


 Apex Code Development
 You need to sign in to do that
Don't have an account?
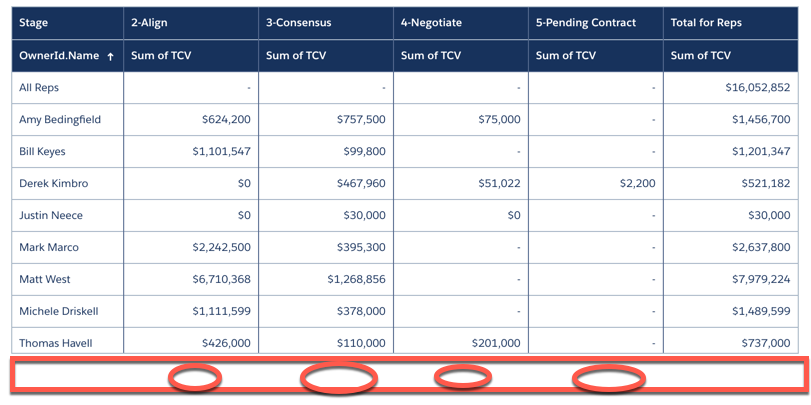
Does anyone know what I would have to add to this SAQL code in order to summarize the stage columns at the bottom of the chart?
q = load "i2i_Opportunities_with_Accounts_and_Users";
q = filter q by 'StageName' in ["2-Align", "3-Consensus", "4-Negotiate", "5-Pending Contract"];
q = group q by rollup('OwnerId.Name', 'StageName');
q = foreach q generate
(case
when grouping('OwnerId.Name') == 1 then "All Reps"
else 'OwnerId.Name'
end) as 'OwnerId.Name',
(case
when grouping('StageName') == 1 then "Total for Reps"
else 'StageName'
end) as 'StageName',
sum('TCV__c') as 'sum_TCV__c';
q = order q by 'OwnerId.Name' asc;
q = limit q 2000;
This code give me the chart below but would love to summarize the stage columns at the bottom.
Does using aggregate functions mentioned in https://developer.salesforce.com/docs/atlas.en-us.bi_dev_guide_saql.meta/bi_dev_guide_saql/bi_saql_functions_aggregate.htm help? Thanks