


 Apex Code Development
 You need to sign in to do that
Don't have an account?
apex:chart barSeries display not suitable
Hi
I create a char with barSeries, but female bar is too short. Any idears?
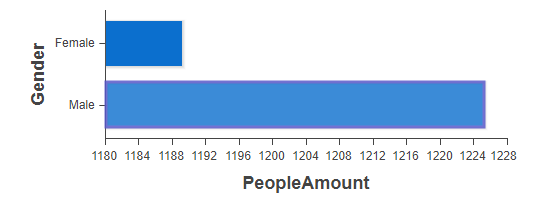
I create a char with barSeries, but female bar is too short. Any idears?
<apex:page >
    <apex:chart data="dataArray" width="500" height="200">
        <apex:axis type="Category" fields="gender" position="left" title="Gender"/>
        <apex:axis type="Numeric" fields="amount" position="bottom" title="PeopleAmount"/>
        <apex:barSeries axis="bottom" orientation="horizontal" xField="amount" yField="gender"/>
    </apex:chart>
    <script>
    	var dataArray = new Array();
        dataArray.push({'amount':1225,'gender':'Male'});
        dataArray.push({'amount':1189,'gender':'Female'});
    </script>
</apex:page>
An integer value that specifies the number of tick marks to places on the axis. If set, it overrides the automatic calculation of tick marks for the axis. Valid only when the axis type is Numeric.
Refer this code
<apex:page > <apex:chart data="dataArray" width="500" height="200"> <apex:axis type="Category" fields="gender" position="left" title="Gender" steps="1"/> <apex:axis type="Numeric" fields="amount" position="bottom" title="PeopleAmount" steps="1"/> <apex:barSeries axis="bottom" orientation="horizontal" xField="amount" yField="gender" /> </apex:chart> <script> var dataArray = new Array(); dataArray.push({'amount':1225,'gender':'Male'}); dataArray.push({'amount':1189,'gender':'Female'}); </script> </apex:page>All Answers
An integer value that specifies the number of tick marks to places on the axis. If set, it overrides the automatic calculation of tick marks for the axis. Valid only when the axis type is Numeric.
Refer this code
<apex:page > <apex:chart data="dataArray" width="500" height="200"> <apex:axis type="Category" fields="gender" position="left" title="Gender" steps="1"/> <apex:axis type="Numeric" fields="amount" position="bottom" title="PeopleAmount" steps="1"/> <apex:barSeries axis="bottom" orientation="horizontal" xField="amount" yField="gender" /> </apex:chart> <script> var dataArray = new Array(); dataArray.push({'amount':1225,'gender':'Male'}); dataArray.push({'amount':1189,'gender':'Female'}); </script> </apex:page>And I have another 2 problem like below.
1. I want to display two chart in a table, I used apex:repeat, but the two charts were dsiplayed in one td.
2. I used colorset to make two bars in different color, but it failed.
What's the reason?
<apex:page controller="TestChartCTRL">
    <apex:repeat value="{!strings}" var="str">
        <table border="1"><tr><td>
            <apex:chart data="dataArray" width="500" height="200">
                <apex:axis type="Category" fields="gender" position="left" title="Gender" steps="1"/>
                <apex:axis type="Numeric" fields="amount" position="bottom" title="PeopleAmount" steps="1"/>
                <apex:barSeries axis="bottom" orientation="horizontal" xField="amount" yField="gender" colorSet="#0000FF,#FF0000">
                    <apex:chartLabel display="insideStart" field="amount" color="#333"/>
                </apex:barSeries>
            </apex:chart>
            </td></tr></table>
    </apex:repeat>
    <script>
    var dataArray = new Array();
    dataArray.push({'amount':1225,'gender':'Male'});
    dataArray.push({'amount':1189,'gender':'Female'});
    </script>
</apex:page>
public class TestChartCTRL { public String[] getStrings() { return new String[]{'ONE','TWO'}; } }