


 Apex Code Development
 You need to sign in to do that
Don't have an account?
apex:chart barSeries displayed in table
Hi,
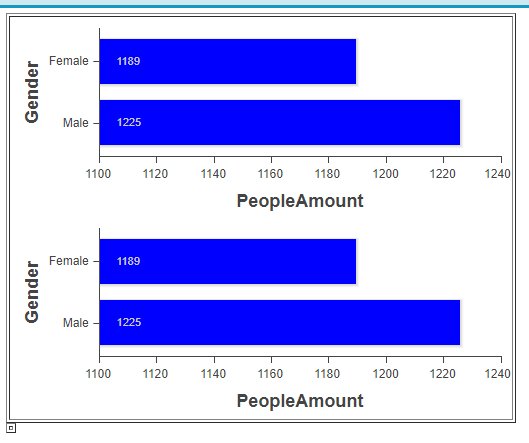
I have two problems below
1. I want to display a chart in each td in a table, I used apex:repeat, but the two charts were dsiplayed in one td.
2. I used colorset to make two bars in different color, but it failed.
What's the reason? Thank you.
I have two problems below
1. I want to display a chart in each td in a table, I used apex:repeat, but the two charts were dsiplayed in one td.
2. I used colorset to make two bars in different color, but it failed.
What's the reason? Thank you.
<apex:page controller="TestChartCTRL">
    <apex:repeat value="{!strings}" var="str">
        <table border="1"><tr><td>
            <apex:chart data="dataArray" width="500" height="200">
                <apex:axis type="Category" fields="gender" position="left" title="Gender" steps="1"/>
                <apex:axis type="Numeric" fields="amount" position="bottom" title="PeopleAmount" steps="1"/>
                <apex:barSeries axis="bottom" orientation="horizontal" xField="amount" yField="gender" colorSet="#0000FF,#FF0000">
                    <apex:chartLabel display="insideStart" field="amount" color="#333"/>
                </apex:barSeries>
            </apex:chart>
            </td></tr></table>
    </apex:repeat>
    <script>
    var dataArray = new Array();
    dataArray.push({'amount':1225,'gender':'Male'});
    dataArray.push({'amount':1189,'gender':'Female'});
    </script>
</apex:page>
public class TestChartCTRL {
	public String[] getStrings() {
        return new String[]{'ONE','TWO'};
    }
}
<apex:page controller="TestChartCTRL"> <apex:repeat value="{!strings}" var="str"> <table border="1"><tr><td> <span id='{!str}'> </span> <apex:chart renderto="{!str}" data="dataArray" width="500" height="200"> <apex:axis type="Category" fields="gender" position="left" title="Gender" steps="1"/> <apex:axis type="Numeric" fields="amount" position="bottom" title="PeopleAmount" steps="1"/> <apex:barSeries axis="bottom" orientation="horizontal" xField="amount" yField="gender" colorsProgressWithinSeries="true" colorSet="#0000FF,#FF0000"> <apex:chartLabel display="insideStart" field="amount" color="#333"/> </apex:barSeries> </apex:chart> </td></tr></table> </apex:repeat> <script> var dataArray = new Array(); dataArray.push({'amount':1225,'gender':'Male'}); dataArray.push({'amount':1189,'gender':'Female'}); </script> </apex:page>All Answers
<apex:page controller="TestChartCTRL"> <apex:repeat value="{!strings}" var="str"> <table border="1"><tr><td> <apex:chart data="dataArray" width="500" height="200"> <apex:axis type="Category" fields="gender" position="left" title="Gender" steps="1"/> <apex:axis type="Numeric" fields="amount" position="bottom" title="PeopleAmount" steps="1"/> <apex:barSeries axis="bottom" orientation="horizontal" xField="amount" yField="gender" colorSet="#37241E,#FF5733" colorsProgressWithinSeries="true"> <apex:chartLabel display="insideStart" field="amount" color="#333"/> </apex:barSeries> </apex:chart> </td></tr></table> </apex:repeat> <script> var dataArray = new Array(); dataArray.push({'amount':1225,'gender':'Male'}); dataArray.push({'amount':1189,'gender':'Female'}); </script> </apex:page><apex:page controller="TestChartCTRL"> <apex:repeat value="{!strings}" var="str"> <table border="1"><tr><td> <span id='{!str}'> </span> <apex:chart renderto="{!str}" data="dataArray" width="500" height="200"> <apex:axis type="Category" fields="gender" position="left" title="Gender" steps="1"/> <apex:axis type="Numeric" fields="amount" position="bottom" title="PeopleAmount" steps="1"/> <apex:barSeries axis="bottom" orientation="horizontal" xField="amount" yField="gender" colorsProgressWithinSeries="true" colorSet="#0000FF,#FF0000"> <apex:chartLabel display="insideStart" field="amount" color="#333"/> </apex:barSeries> </apex:chart> </td></tr></table> </apex:repeat> <script> var dataArray = new Array(); dataArray.push({'amount':1225,'gender':'Male'}); dataArray.push({'amount':1189,'gender':'Female'}); </script> </apex:page>