


 Apex Code Development
 You need to sign in to do that
Don't have an account?
Chart from 2 objects
Hi all!
We use the revunue scheduler to track our customer installments (works like a charm) and an custom object 'Payments__c' where payment detaisl are entered.
Now I want to create 1 chart with bucketed date values (per month) on x-asis and includes both the expected payments (from OppertunityProduct object) and the actual payments on y-axis as 2 seperate lines/bars. Does anyonde have an idea how to resolve?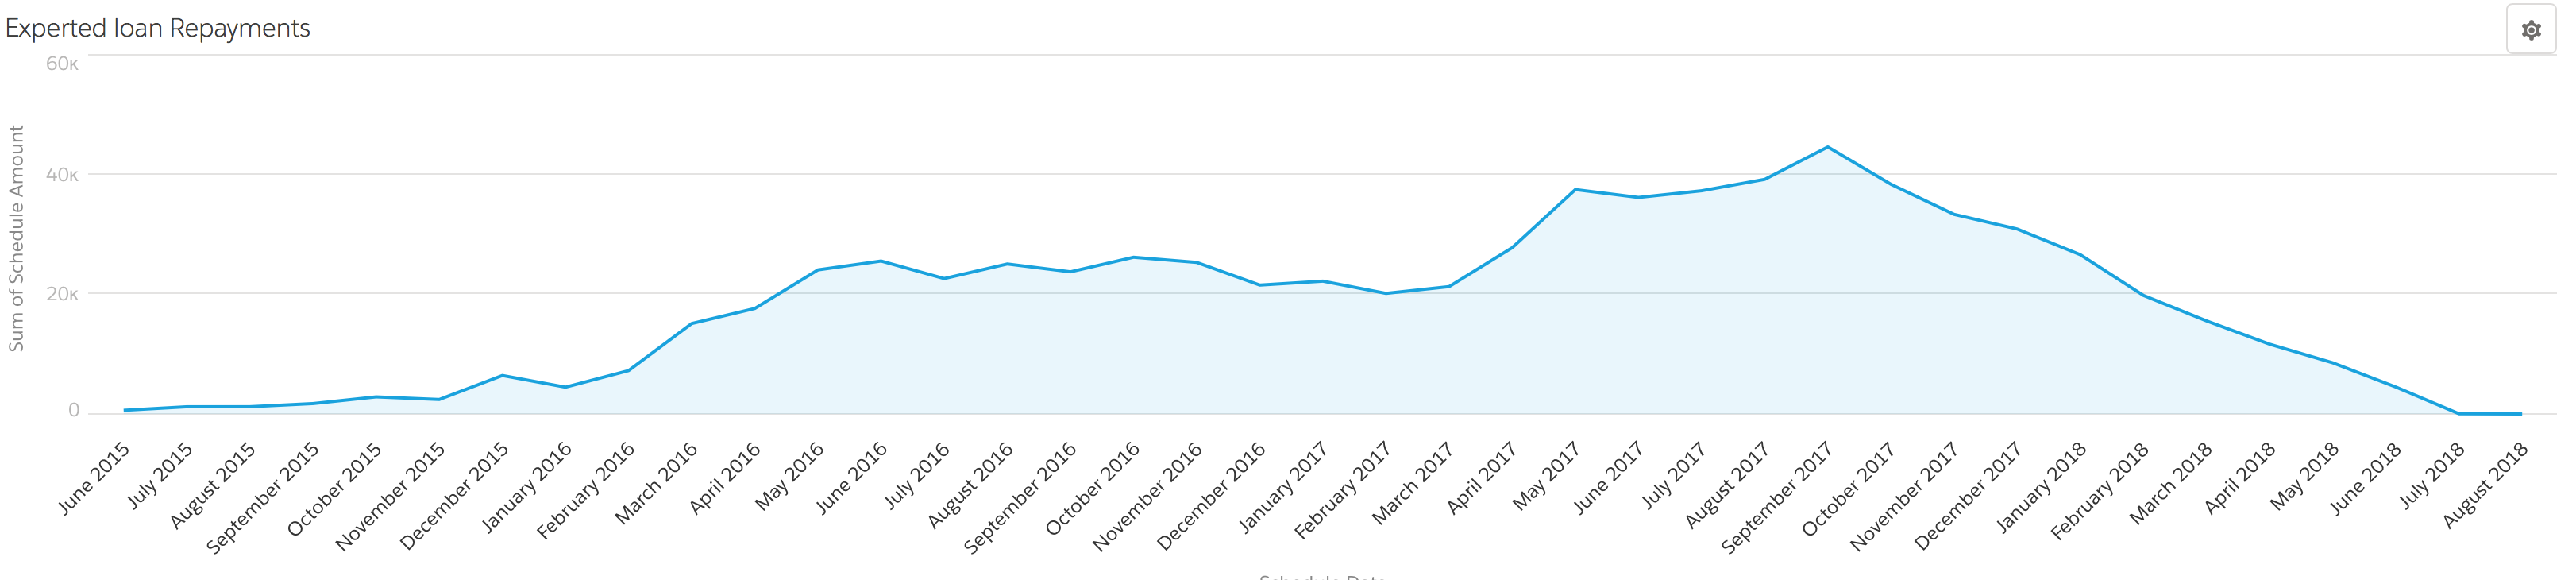
See report from revenue schedule below: