


 Apex Code Development
 You need to sign in to do that
Don't have an account?
bar in bar chart not matching with value on Y-axis
Hello,
I did a chart in a visualforce, my chart has only 2 values to draw as bars in bar chart, but i notice that the draw of the bar doesn't match with the value on the Y-Axis, for example this case:
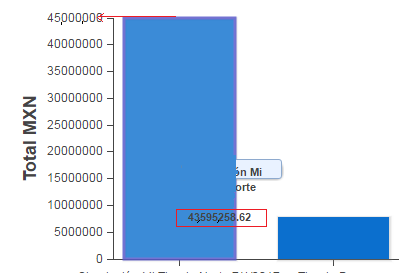
My first bar has a value of: $43'595'258.62 but if you go to the Y-Axis and look where the graphic is ending it is in the 45'000'000 final value.
Why is it acting like that?
This is my chart (VF) :
This is my controller:
I did a chart in a visualforce, my chart has only 2 values to draw as bars in bar chart, but i notice that the draw of the bar doesn't match with the value on the Y-Axis, for example this case:
My first bar has a value of: $43'595'258.62 but if you go to the Y-Axis and look where the graphic is ending it is in the 45'000'000 final value.
Why is it acting like that?
This is my chart (VF) :
<apex:chart data="{!data}" height="300" width="400" resizable="True">
    <apex:axis type="Numeric" position="left" title="Total MXN" fields="data1" maximum="{!maximum}" minimum="0" />
    <apex:axis type="Category" position="bottom" fields="name" />
    <apex:barSeries orientation="vertical" axis="left"
        xField="name" yField="data1" title="Simulacion"/>
</apex:chart>
This is my controller:
public Data[] getData() {

        if(simulacion.importe__c >= simulacion.plantilla_relacionada__r.importe_total__c){
            maximum = simulacion.importe__c;
        } else {
            maximum = simulacion.plantilla_relacionada__r.importe_total__c;
        }
/* I don't know if i need to have this maximum and min values in my chart, but when i declare it it turns a more specific graphic bar than when i don't do this. I can only have 2 and only 2 values in my chart, that's why i need to choose between those, which one is the bigger. */

    return new Data[] {
        new Data('test1', simulacion.Importe__c),
        new Data('test2', simulacion.plantilla_relacionada__r.Importe_Total__c)
        };

    }