


 Apex Code Development
 You need to sign in to do that
Don't have an account?
Google chart not showing complete data on x axis
Hi friends
I have created the Google chart and I am using in my Visualforce age
and passing data from m visualforce page apex controller
but on the x-axis of the chart below some bar data is not showing completely
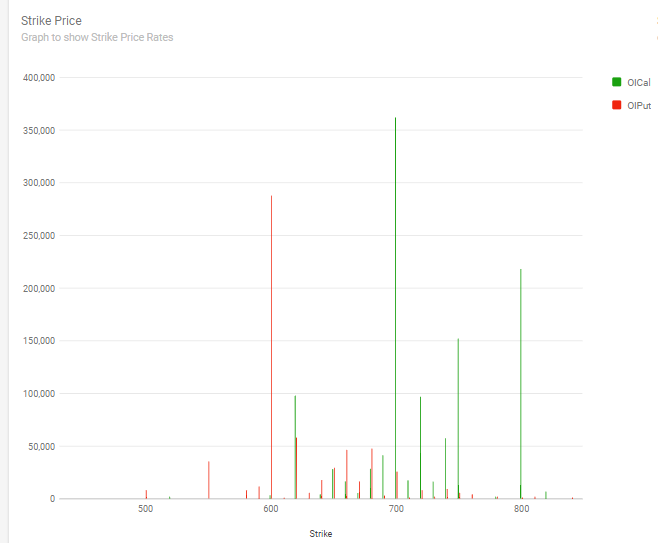
can you please tell me what is the issue here and how can i fix this
Thank you
I have created the Google chart and I am using in my Visualforce age
and passing data from m visualforce page apex controller
but on the x-axis of the chart below some bar data is not showing completely
can you please tell me what is the issue here and how can i fix this
Thank you
I tried this but no use
here is my chart code
<apex:includeScript id="a" value="https://www.google.com/jsapi" />
        <script type="text/javascript" src="https://www.gstatic.com/charts/loader.js"></script>
        <script type="text/javascript">
            google.charts.load('current', {'packages':['bar']});
        google.charts.setOnLoadCallback(drawChart);
        //Strike chart
        function drawChart() {
            var data = google.visualization.arrayToDataTable({! dataList});
            console.log("{!rangeList}",{!rangeList}); //rangeList contains 410,429,430,450....
            var options = {
                chart: {
                    title: 'Strike Price',
                    subtitle: 'Graph to show Strike Price Rates',
                },
                bars: 'vertical',
                bar: { groupWidth: "25%" },
                hAxis: {showTextEvery: 10},
                hAxis: {
                    viewWindow: {
                        max: 1000
                    },
                    ticks: {!rangeList}
                },

                vAxis: {format: 'decimal'},
                hAxis: {format: 'decimal'},
                height: 700,
                colors: ['#1aa110', '#f0250e',]
                         };

                         var chart = new google.charts.Bar(document.getElementById('chart_div'));
                         chart.draw(data, google.charts.Bar.convertOptions(options));
                         }

        </script>