


 Apex Code Development
 You need to sign in to do that
Don't have an account?
Einstein Analytics and Discovery Insights Specialist - Step 2
I'm stuck on step #2 of Einstein Analytics and Discovery Insights Specialist superbadge. I'm getting this warning while checking the challenge:
The step "Churn Tenure' is in compact form, so the filter values need to be specifed as a minimum and maximum
The static step that feeds has the following the value:
I'm using selection binding for min and max values. The dashboard is correctly filtering:
Any ideas?
I've tried a non-compact form step where I inject a saql fragment into the query, as well as where I inject min/max values using a range filter serialization...All these efforts end in the same challenge failure message.
Any help/suggesitions are welcome!
The step "Churn Tenure' is in compact form, so the filter values need to be specifed as a minimum and maximum
The static step that feeds has the following the value:
"Tenure_Length": {
                "broadcastFacet": false,
                "label": "Tenure Length",
                "selectMode": "single",
                "type": "staticflex",
                "values": [
                    {
                        "display": "High Risk",
                        "value": "1 to 12 months",
                        "min": 1,
                        "max": 12
                    },
                    ...
                ]
            }
I'm using selection binding for min and max values. The dashboard is correctly filtering:
Any ideas?
I've tried a non-compact form step where I inject a saql fragment into the query, as well as where I inject min/max values using a range filter serialization...All these efforts end in the same challenge failure message.
Any help/suggesitions are welcome!
I assume that you completed the Step one of the challenge to reach here and I am stuck at the Step 1 to create the Churn Rate field. Not able to turn my head around with all the known information specially for the quarters where there are no subscription but only cancellation like 2016 -4 and 2017-4 Can you please help with the approach you have taken?
Regards
Mitesh
Happy holidays from NYC! In quasi-code, I did step one like this:
- Load the dataset into q
- filter q into a new stream (cancellations) by Churn (you want the number of cancellations, so set the churn bit appropriately)
- Group cancellations by ChurnDate year/quarter but project the date as ActivityDate year/quarter; count() as current quarter cancellations,
- you then need to lag cancellations by one period, so generate again but this time collect 'cancellations' by sum and in a separate column, include a window function with sum to pick up the prior period. I won't tell you have to do it, but read up on windowing
- group q by Subscription_Date year/quarter
- generate a count() for "subscribers" and like above, project subscription_date year/quarter as ActiviityDate year/quarter.
- re-generate the stream from step 6 as a sum of "subscribers" and add lagged subscribers by the same windowing sum that you did for cancelllations.
- then you can either cogroup with a full join on ActivityDate year/quarter (and then generate the formula you need) or union and regroup by ActivityDate year/quarter.
Remember that the formula for churn in this step is current quarter cancellations/(current subscribers + subscribers from a quarter ago - cancellations from a quarter below)Its super tricky but concentrate on 1) windowing to get the proper lag and 2) joining the streams to get your formula constituent parts.
Hope this helps!
Regards,
Peter
Thanks for the detailed elaboration as the pseudo code and wishing you and your family merry christmas and Happy New Year. Will give the approach you suggested a shot and progress with my challenge :-)
Happy holidays
Regards
Mitesh
Hope you have made good progress on the Challenge and Super badge. I am on the final step and not able to go past the step with error
Challenge Not yet complete... here's what's wrong:
We couldn’t find the correct information associated with Apex trigger named SetDealPrediction. Confirm the Salesforce object and integration name
My Trigger works absolutely fine and the Custom setting name is also 'Tenure'
Can you please help.
Regards
Mitesh
Just finished this Superbadge. For Step two you can try following steps:
a) Get the Toggle widget to be bound with Static step
b) For the Value of Static step kindly use range and we will use range serialixation later for the binding purpose. Eg below
"display": "High Risk",
"value": "1 to 12 months",
"min": 1,
"max": 12
c) Filter first stream by binded results and another stream by Churn(Cancelation stream per your teminology) (remeber we have to provide the ratio of Churned to Subscribed.
d) The you can do group by all full
Hope it helps.
Regards
Mitesh
q = load \"Beattie_Subs\";\n
q = filter q by {{row(Tenure_Length.selection, [0], [\"min\",\"max\"]).asRange(\"Tenure\")}};\n
q_B = filter q by 'Churn' == \"Yes\";\n
result = group q by all full, q_B by all;\n
result = foreach result generate (count(q_B)/ count(q))*100 as 'churnRate';
Further, the numbers actually make sense (High Risk has a larger churn rate than Medium and Low risk). Stumped!If thats the case and you have all the steps for Challenge # 2 complete I advice you to please check the order/sequencing of the tasks to accomplish challenge # 2 and others as well. My observation was that the app and the Churn rate or any other bindings if registered wrongly the first time will cause issue in the verification. I reached to partner support collaboration group as well for these issues and below if the link.
Feel free to reach to me for any assistance and I will be happy to help you folks.
Regards
Mitesh
my thought is to first cogroup both cancellation and subscription streams, then determine the prior counts based on that inclusive period stream. though I don't seem to be able to get the windowing function to order by the grouped period set.
hints???
I am getting the error "Challenge Not yet complete... here's what's wrong: We can't confirm the chart reference lines have the correct label and value. The reference line has to have attrition costs as its label and value, plus filter by the Tenure Length toggle." while validating challenge 3; although the reference line has the attriCost data as its label & value as given in the challenge and it is connected to be filtered by the tenure length toggle. Any suggestions?
Please see below the screenshots for the chart
All bindings issues are due to step name (@peter : your saql is ok)
Please follow these names :
Regards
- union churn+sub to get all quarters
- cogroup quarter+sub with coallesce for null value and windows to get sum of subscribe => TotSub
- cogroug quarter+chrun with coallesce for null value and windows to get previous => CurrentChurn and PreviousChurn
- cogroup ope2 and op3 to get result with correct formula : CurrentChurn/(TotSub-PreviousChurn) as 'Churn'
How did you get past the error you encountered on Challenge 5, "We couldn’t find the correct information associated with Apex trigger named SetDealPrediction. Confirm the Salesforce object and integration name" ?
Check if you have used "Tenure" (without quotes) as the name (integration name) for your entry in the Einstein Discovery-Write Back Detail Custom Setting as well as in the Apex trigger named SetDealPrediction.
I have actually earlier used a random name for integration but then I recreated the Custom setting and the trigger once again for the app and that helped me completing the challenge. Hope that helps!
Regards
Mitesh
For the Step 1 I was also stuck but then the quasi code from Peter Greenbaum helped me clear the challenge. The same can be seen in this message trail. The cogroup on the period should be done prior to windowing in both the cases ie Churn or cancellation and subscription and you should be able to use the calculated column for the churn rate then.
If I share my implementation steps that would spoil the fun :-)
If you are stuck then will be happy to help
Regards
Mitesh
please show me your pretty chart.
I am stuck on step 3
my result image is not bad.
how to use filter for this requirement.
"Also, make it possible for the reference line value to filter by length of tenure from the Tenure Length toggle."
my filter is wrong place?
"measureAxis1": {
    "sqrtScale": false,
    "showTitle": true,
    "showAxis": true,
    "referenceLines": [
        {
            "color": "#E84340",
            "label": "{{cell(Attrition_Cost_1.result, 0, \"attrCost\").asString()}}",
            "value": "{{cell(Attrition_Cost_1.result, 0, \"attrCost\").asString()}}"
        }
    ],
	"filters": [
	   [
	      "Tenure",
	      "{{ column( Tenure_Length_1.selection, [\"Tenure\"] ).asObject() }}",
	      "in"
	   ]
	],
    "title": "Subscription Revenue",
    "customDomain": {
        "showDomain": false
    }
},
Thanks
issue comes from attrition step name : not xxx_1
I removed my hard code filters, and edit step names as you mentioned in old post.
then, error is changed!
automatic facet binding is not working?
Regards,
LinThaw
filter q by {{row(Tenure_Length_1.selection, [0], [\"min\",\"max\"]).asRange(\"Tenure\")}};After add filter to query of Attrition Cost, its worked!I am stuck since several days on the step 1. I have a doubt on how I use the windowing functions to sum over the previous period. Could you please let me know what is wrong in the following SAQL code?
q = load "Beattie_Subs";

cancel = group q by ('Churn_Date_Year', 'Churn_Date_Quarter');
cancel = foreach cancel generate cancel.'Churn_Date_Year' + "~~~" + cancel.'Churn_Date_Quarter' as 'ActivityDate_Year~~~ActivityDate_Quarter', count() as 'New Quarter Cancellations';

cancel = group cancel by ('ActivityDate_Year~~~ActivityDate_Quarter');
cancel = foreach cancel generate cancel.'ActivityDate_Year~~~ActivityDate_Quarter' as 'ActivityDate_Year~~~ActivityDate_Quarter', coalesce(sum(cancel.'New Quarter Cancellations'),0) as 'New Quarter Cancellations', coalesce(sum(sum('New Quarter Cancellations')) over ([..-1] partition by all order by ('ActivityDate_Year~~~ActivityDate_Quarter')),0) as 'Previous Quarter Cancellations';

sub = group q by ('Subscription_Date_Year', 'Subscription_Date_Quarter');
sub = foreach sub generate sub.'Subscription_Date_Year' + "~~~" + sub.'Subscription_Date_Quarter' as 'ActivityDate_Year~~~ActivityDate_Quarter', count() as 'New Quarter Subcribers';

sub = group sub by ('ActivityDate_Year~~~ActivityDate_Quarter');
sub = foreach sub generate sub.'ActivityDate_Year~~~ActivityDate_Quarter' as 'ActivityDate_Year~~~ActivityDate_Quarter', coalesce(sum(sub.'New Quarter Subcribers'),0) as 'New Quarter Subcribers', coalesce(sum(sum('New Quarter Subcribers')) over ([..-1] partition by all order by ('ActivityDate_Year~~~ActivityDate_Quarter')),0) as 'Previous Quarter Subcribers';

result = cogroup sub by 'ActivityDate_Year~~~ActivityDate_Quarter' full, cancel by 'ActivityDate_Year~~~ActivityDate_Quarter';
result = foreach result generate coalesce(sub.'ActivityDate_Year~~~ActivityDate_Quarter', cancel.'ActivityDate_Year~~~ActivityDate_Quarter') as 'ActivityDate_Year~~~ActivityDate_Quarter', sum(cancel.'New Quarter Cancellations')/(sum(sub.'New Quarter Subcribers') + sum(sub.'Previous Quarter Subcribers') - sum(cancel.'Previous Quarter Cancellations')) as 'Churn Rate';
Thanks by advance for your help.
Julien
Hmm. Looks close.
Try defining the window on line 7 as [-1..-1]
Try defining the window on line 13 a [-1..0]
That's what worked for me. Good luck
I see that the Churn Rate is greater than 100% on 2018-2 which lloks weird to me:
I am stucked on step #2
I created my widget chart as well as my toggle with the static step.
I linked the static step with the chart and the JSON is correct but I'm gitting this error message when trying to display the chart :
"This widget can't be displayed because there is a problem with its source step:
The binding ' cell(Tenure_Length_1.selection, 0, "values").asObject() ' contains an error: No data found at row index 0, column name 'values'."
I tried with several row indexes but it still displays the same error.
Does someone have insights on this point?
Thanks!!!
Here is my JSON :
"steps": { "Tenure_Length_1": { "broadcastFacet": true, "label": "Tenure Length", "selectMode": "single", "type": "staticflex", "values": [ { "display": "High Risk", "value": [ [ "count", "*", "A" ], [ "count", "*", "B" ], [ "count", "*", "C" ] ], "columns": [ { "query": { "measures": [ [ "count", "*" ] ], "filters": [ [ "Churn", [ "Yes" ], "in" ] ] } }, { "query": { "measures": [ [ "count", "*" ] ] } }, { "query": { "measures": [ [ "count", "*" ] ], "formula": "A/B" }, "format": "number" } ], "filters": [ [ "Tenure", [ [ 1, 12 ] ], ">=<=" ] ] }, { "display": "Medium Risk", "value": [ [ "count", "*", "A" ], [ "count", "*", "B" ], [ "count", "*", "C" ] ], "columns": [ { "query": { "measures": [ [ "count", "*" ] ], "filters": [ [ "Churn", [ "Yes" ], "in" ] ] } }, { "query": { "measures": [ [ "count", "*" ] ] } }, { "query": { "measures": [ [ "count", "*" ] ], "formula": "A/B" }, "format": "number" } ], "filters": [ [ "Tenure", [ [ 13, 24 ] ], ">=<=" ] ] }, { "display": "Low Risk", "value": [ [ "count", "*", "A" ], [ "count", "*", "B" ], [ "count", "*", "C" ] ], "columns": [ { "query": { "measures": [ [ "count", "*" ] ], "filters": [ [ "Churn", [ "Yes" ], "in" ] ] } }, { "query": { "measures": [ [ "count", "*" ] ] } }, { "query": { "measures": [ [ "count", "*" ] ], "formula": "A/B" }, "format": "number" } ], "filters": [ [ "Tenure", [ [ 25, 36 ] ], ">=<=" ] ] } ] }, "Churn_Tenure_1": { "broadcastFacet": true, "datasets": [ { "id": "0Fb1t000000XjFcCAK", "label": "Beattie Subs", "name": "Beattie_Subs", "url": "/services/data/v44.0/wave/datasets/0Fb1t000000XjFcCAK" } ], "isGlobal": false, "label": "Churn Tenure", "query": { "measures": "{{ cell(Tenure_Length_1.selection, 0, \"values\").asObject() }}" },you need to following steps from this link.
and then you can find Prediction Definition Id from MODEL. also be careful on label name.
Good luck, Regards.
LinThaw
I am struck with Step # 2
i was able to create the churn chart with the below code, but not able to link the toggle, require help
"Tenure_Length_1": { "broadcastFacet": false, "label": "Tenure Length", "selectMode": "single", "type": "staticflex", "values": [ { "display": "High Risk", "value": "1 to 12 months", "min": 1, "max": 12 }, ... ] }Hope this helps, Ravi
help required how to get the activation id, not finding the option
Same message appear, trigger have been deleted and created a lot of time same things with the custom settings
Challenge Not yet complete... here's what's wrong:
We couldn’t find the correct information associated with Apex trigger named SetDealPrediction. Confirm the Salesforce object and integration name.
The trigger is working fine and Subscriber records are updated on edit.
In custom settings:
Name = Tenure
and the trigger contain
String CONFIG_NAME = 'Tenure';
I used this one for single object with no data transformation.
how about you?
trigger SetDealPrediction on Subscriber__c (after insert, after update) { if(System.isFuture()) return; if(ed_insights.CheckRecursive.runOnce()) { // custom Settings' name String CONFIG_NAME = 'Tenure'; ed_insights.TriggerHandler.insertUpdateHandle(CONFIG_NAME); } }Regards,LinThaw
Hellooooo!
Challenge #2
Anyone got binding the toggle to the chart? In my wasn't made it automatically. How can I do this?
Challenge Not yet complete... here's what's wrong:
We can't confirm this is the correct quarter. Records should be grouped by subscriber activity (sign ups and cancellations). A suggestion is to generate a stream for subscriber records by Subscription Date andits counts, along with Churn Date and its counts. Ensure both streams for these date fields share a common variable then create a union of both streams.
Close errors
My query looks like this:
q = load "beattie_subs"; cancel = group q by ('Churn_Date__c_Year', 'Churn_Date__c_Quarter'); cancel = foreach cancel generate cancel.'Churn_Date__c_Year' + "~~~" + cancel.'Churn_Date__c_Quarter' as 'ActivityDate_Year~~~ActivityDate_Quarter', count() as 'New Quarter Cancellations'; cancel = group cancel by ('ActivityDate_Year~~~ActivityDate_Quarter'); cancel = foreach cancel generate cancel.'ActivityDate_Year~~~ActivityDate_Quarter' as 'ActivityDate_Year~~~ActivityDate_Quarter', coalesce(sum(cancel.'New Quarter Cancellations'),0) as 'New Quarter Cancellations', coalesce(sum(sum('New Quarter Cancellations')) over ([-1..-1] partition by all order by ('ActivityDate_Year~~~ActivityDate_Quarter')),0) as 'Previous Quarter Cancellations'; sub = group q by ('Subscription_Date__c_Year', 'Subscription_Date__c_Quarter'); sub = foreach sub generate sub.'Subscription_Date__c_Year' + "~~~" + sub.'Subscription_Date__c_Quarter' as 'ActivityDate_Year~~~ActivityDate_Quarter', count() as 'New Quarter Subcribers'; sub = group sub by ('ActivityDate_Year~~~ActivityDate_Quarter'); sub = foreach sub generate sub.'ActivityDate_Year~~~ActivityDate_Quarter' as 'ActivityDate_Year~~~ActivityDate_Quarter', coalesce(sum(sub.'New Quarter Subcribers'),0) as 'New Quarter Subcribers', coalesce(sum(sum('New Quarter Subcribers')) over ([-1..0] partition by all order by ('ActivityDate_Year~~~ActivityDate_Quarter')),0) as 'Previous Quarter Subcribers'; result = cogroup sub by 'ActivityDate_Year~~~ActivityDate_Quarter' full, cancel by 'ActivityDate_Year~~~ActivityDate_Quarter'; result = foreach result generate coalesce(sub.'ActivityDate_Year~~~ActivityDate_Quarter', cancel.'ActivityDate_Year~~~ActivityDate_Quarter') as 'ActivityDate_Year~~~ActivityDate_Quarter', sum(cancel.'New Quarter Cancellations')/(sum(sub.'New Quarter Subcribers') + sum(sub.'Previous Quarter Subcribers') - sum(cancel.'Previous Quarter Cancellations')) as 'Churn Rate';The produced chart seems to be correct. I don't know what I am missing. Do I need to create new fields(SubscriptionDate_Year, SubscriptionDate_Quarter, ChurnDate_Year, ChurnDate_Quarter) on the Subscriber object or just use those created by EA during the dataflow as I did now?I am struggling with the step 3 in the super badge.
i have created Subscriber Revenue bar chart.
Now i am Not getting next steps:
4. Create another step, with Attrition Cost as the name , that calculates subscriber attrition cost, [Churned Subscribers (Churn = ‘Yes’) x $950.00].
5. Use the projection name attrCost for your calculation in the previous step.
6. Add a reference line to the Subscriber Revenue chart.
Please guide me for this step!
Add this to your chart as a reference line. Once done, go to SAQL and add result binding of tenure length to this so that reference line changes per your selection.
Hope this helps.
I'm also stuck on step 3,
In the json, i'm trying to bind the Attrition Cost to the Subscriber Revenue reference line by doing the following :
{ "color": "#E84340", "label": "Attrition cost", "value": {{cell(Attrition_Cost_1.result, 0, "attrCost").asString()}} } ],But I have a message that the json is not valid.
Thanks for helping me.
The JSON is invalid because you have to wrap the binding in quotes:
"value": "{{cell(Attrition_Cost_1.result, 0, "attrCost").asString()}}"
Also, i think you need to serialize using asObject(), not asString().
Hope that helps!
Thanks for your help.
Just found this page : https://developer.salesforce.com/docs/atlas.en-us.bi_dev_guide_bindings.meta/bi_dev_guide_bindings/bi_dashboard_bindings_wave_designer_set_reference_line.htm
It is working with asString() for both value and label.
Now I'm struggling with the filter using the toogle.
filter q by {{row(Tenure_Length_1.selection, [0], [\"min\",\"max\"]).asRange(\"Tenure\")}};as a filter to query in Attrition Cost SAQL.
Thanks a lot LinThaw !
Could not parse binding: Parse error on line 1: ...th_1.selection,[0],[\"min\",\"max\"]).as -----------------------^ Expecting 'INTEGER', '-', 'STRING', ']', got 'IDENTIFIER'."
here is my Saql
q = load "Beattie_Subs"; filter q by {{row(Tenure_Length_1.selection,[0],[\"min\",\"max\"]).asRange (\"Tenure\")}};q_B = filter q by 'Churn' == "Yes"; result = group q by all full, q_B by all; result = foreach result generate (count(q_B) / count(q))*100 as 'churnRate';
Line 2 you are missing q=filter q ....
q = load "Beattie_Subs";
q=filter q by {{row(Tenure_Length_1.selection,[0],[\"min\",\"max\"]).asRange (\"Tenure\")}};
q_B = filter q by 'Churn' == "Yes";
result = group q by all full, q_B by all; result = foreach result generate (count(q_B) / count(q))*100 as 'churnRate';
I'm struggling on step 4 with the cogroup to display data from both datasets:
I'm using :
But i can't get to group by the region... this is driving me crazy
After you co-group, you generate a stream but your stream is missing the dimension you want to group by, it only has mesures (Avg customer satisfaction and tenure). You have to add the Region dimension to your stream. So, something like this would work:
Hope this helps.
This has done the trick !
I am stuck on step #5 now, what they mean on
Create a story in Einstein Discovery
4.Name your final prediction Predicted Tenure. Name the Story Predicted Tenure ? Because I have everything working even on edit
Subscriber object In salesforce I get: Tenure Outcome 16 and Tenure Explanation +0.435 because Modem Age is 1 - 2 Years and Tenure Prescription +3.568 if you change Modem Age to New (with many more rows)
So Subscriber object is fine, trigger is working also , but still getting error:
Challenge Not yet complete... here's what's wrong:
We can't find your recommendation. Confirm a 'Predicted Tenure' recommendation exists.
The problem vas the deploy model name this should follow Predicted tenure . But thanks all guys !
I am stuck on step 1 of this superbadge. My chart looks exactly as the sample in the challenge and I have my chart marker set on the first quarter that is showing a Churn Rate; however, I keep getting the error message below:
Here is my chart and saql:
q = load "Beattie_Subs"; Subscribers = group q by ('Subscription_Date_Year', 'Subscription_Date_Quarter'); Subscribers = foreach Subscribers generate 'Subscription_Date_Year' + "-" + 'Subscription_Date_Quarter' as 'ActivityDate_Year-ActivityDate_Quarter', count() as 'Current Quarter Subscribers'; Churns = group q by ('Churn_Date_Year', 'Churn_Date_Quarter'); Churns = foreach Churns generate 'Churn_Date_Year' + "-" + 'Churn_Date_Quarter' as 'ActivityDate_Year-ActivityDate_Quarter', count() as 'Current Quarter Churns'; Result = group Subscribers by 'ActivityDate_Year-ActivityDate_Quarter' full, Churns by 'ActivityDate_Year-ActivityDate_Quarter'; Result = foreach Result generate coalesce(Subscribers.'ActivityDate_Year-ActivityDate_Quarter', Churns.'ActivityDate_Year-ActivityDate_Quarter') as 'ActivityDate_Year-ActivityDate_Quarter', sum(Subscribers.'Current Quarter Subscribers') as 'Current Quarter Subscribers', sum(Churns.'Current Quarter Churns') as 'Current Quarter Churns'; Result = group Result by ('ActivityDate_Year-ActivityDate_Quarter', 'Current Quarter Subscribers', 'Current Quarter Churns'); Result = foreach Result generate 'ActivityDate_Year-ActivityDate_Quarter', sum('Current Quarter Subscribers') as 'Current Quarter Subscribers', 'Current Quarter Churns', sum('Current Quarter Subscribers') over ([..-1] partition by all order by 'ActivityDate_Year-ActivityDate_Quarter') - coalesce(sum('Current Quarter Churns') over ([-1..-1] partition by all order by 'ActivityDate_Year-ActivityDate_Quarter'),0) as 'Previous Quarter Subscribers'; Result = foreach Result generate 'ActivityDate_Year-ActivityDate_Quarter', 'Current Quarter Churns'/(coalesce('Previous Quarter Subscribers',0) + coalesce('Current Quarter Subscribers',0)) as 'Churn Rate';I know that Q3 2016 has to be the first quarter with a churn rate because I also pulled the dataset into Excel and pivoted the data on Churn Date Year/Quarter and that is the first quarter with any cancellations. Any thoughts or suggestions would be really appreciated as I'm getting a bit frustrated with this one.
Thanks!
After adding the attrition cost as reference line and updating the JSON as below:
"referenceLines": [ { "color": "#E84340", "label": "Attrition Cost", "value": "{{cell(Attrition_Cost_1.result, 0, \"attrCost\").asObject()}}" }I am updating the JSON for Attrition Cost to:
q = load \"Beattie_Subs\"; q = filter q by{{row(Tenure_Length_1.selection,[0],[\"min\",\"max\"]).asRange (\"Tenure\")}}; q_B = filter q by 'Churn' == \"Yes\"; result = group q by all full, q_B by all; result = for each result generate count((q_B))*950 as 'attrCost';I am still unable to go to next challenge. Sometimes it throws an error for Attrition Cost and sometimes it doesn't. could anyone help me here?
I am stuck on the challenge 3 and getting the error :
query :
"query": "beattieSubscribers = load \"Beattie_Subs\"; \ntenuredSubscribers = filter beattieSubscribers by{{row(Tenure_Length_1.selection,[0],[\"min\",\"max\"]).asRange (\"Tenure\")}}; \nchurnedSubscribers = filter tenuredSubscribers by 'Churn' == \"Yes\"; \ngroupedSubscribers = group tenuredSubscribers by all full, churnedSubscribers by all;\nattrCost = foreach groupedSubscribers generate count(churnedSubscribers)*950 as 'attrCost';",
adding attrition cost as refernce line in JSON:
"referenceLines": [
{
"color": "rgb(0, 161, 224)",
"label": " attrition costs",
"value": "{{cell(Attrition_Cost_1.result,0,\"attrCost\").asString()}}"
}
],
Challenge Not yet complete... here's what's wrong:
We can't confirm the chart reference lines have the correct label and value. The reference line has to have attrition costs as its label and value, plus filter by the Tenure Length toggle.
Please help guys, i want to complete this superbadge.
Regards,
Akash Garg
I found the workaround please update the refernceLines JSON as below :
"referenceLines": [
{
"color": "#E84340",
"label": "{{cell(Attrition_Cost_1.result,0,\"attrCost\").asString()}}",
"value": "{{cell(Attrition_Cost_1.result,0,\"attrCost\").asString()}}"
}
],
It helped me to go to the next challenge, I hope it would work for you too.
I tried updating the label as well and the value field in JSON but it didn't work. I am not getting any error but when I save and click preview, the toggle changes for Churn Tenure and does nothing for Subscriber Count. I am getting the same error as you got when I check the challenge.
Could you help me with Challenge 3? I tried all changes I can think of and still not able to move ahead.
Cheers.
Sandeep
I am not sure what step did you wrong, please check these.
In my case my step name is Attrition_Cost_1
[Attrition Cost]
[Reference Line]
"referenceLines": [ { "color": "#E84340", "label": "{{cell(Attrition_Cost_1.result, 0, \"attrCost\").asString()}}", "value": "{{cell(Attrition_Cost_1.result, 0, \"attrCost\").asString()}}" } ],Congrats :)
LinThaw
I found the issue, the code was correct, I forgot to run the query in Attrition Cost step and it caused the problem. I deleted the step and reference lines and saved it and then started from beginning and then it worked. Now onto Challenge 4.
I did it, my first super badge!!
Thanks Peter, Alexandre, LinTaw, Mathieu,Chintamani and the rest of fellows.
Hi All,
I am getting following error beacuse i am unable to bind widget and chart->
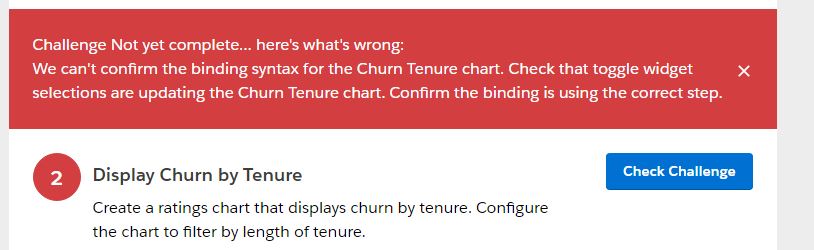
Display Churn by Tenure
Any thought or advise would be apprecitable!!
Can you post the jsons of churn_tenure and tenure_length steps?, I had some different errors: sometimes the json generates two slashes (\\), the index in the binding line must be in brackets ([0]) and so on
Following is the json section of churn_tenure and tenure_length: Please have a look and let me know where am i doing mistake..
"steps":{"Tenure_Length_1":{"broadcastFacet":false,"label":"Tenure Length","selectMode":"single","start":{"display":[]},"type":"staticflex","values":[{"display":"High Risk","value":"1 to 12 months"},{"display":"Medium Risk","value":"13 to 24 months"},{"display":"Low Risk","value":"25 to 36 months"}],"numbers":[],"strings":[],"groups":[]},"Churn_Tenure_1":{"broadcastFacet":true,"groups":[],"label":"Churn Tenure","numbers":[],"query":"q = load \"Beattie_Subs\";\r\n\r\nq = filter q by 'Tenure' >= 0 && 'Tenure' <= 100;\r\nq_B = filter q by 'Churn' == \"Yes\";\r\nresult = group q by all full, q_B by all;\r\nresult = foreach result generate (count(q_B) / count(q))*100 as 'churnRate';","receiveFacet":true,"selectMode":"single","strings":[],"type":"chart","useGlobal":true,"parameters":{"autoFitMode":"keepLabels","showValues":true,"bins":{"breakpoints":{"high":100,"low":0},"bands":{"high":{"color":"#008000","label":""},"low":{"color":"#B22222","label":""},"medium":{"color":"#ffa500","label":""}}},"legend":{"descOrder":false,"showHeader":true,"show":true,"customSize":"auto","position":"right-top","inside":false},"axisMode":"multi","tooltip":{"showBinLabel":true,"measures":"","showNullValues":true,"showPercentage":true,"showDimensions":true,"showMeasures":true,"customizeTooltip":false,"dimensions":""},"visualizationType":"hbar","title":{"fontSize":14,"subtitleFontSize":11,"label":"","align":"center","subtitleLabel":""},"binValues":false,"trellis":{"flipLabels":false,"showGridLines":true,"size":[100,100],"enable":false,"type":"x","chartsPerLine":4},"showActionMenu":true,"measureAxis2":{"sqrtScale":false,"showTitle":true,"showAxis":true,"title":"","customDomain":{"showDomain":false}},"measureAxis1":{"sqrtScale":false,"showTitle":true,"showAxis":true,"title":"","customDomain":{"showDomain":false}},"theme":"wave","dimensionAxis":{"showTitle":true,"customSize":"auto","showAxis":true,"title":"","icons":{"useIcons":false,"iconProps":{"fit":"cover","column":"","type":"round"}}},"applyConditionalFormatting":true}}}}
I see a couple of things, you have to connect/bind the two steps through the query in churn_tenure, this is what I have:
"query": "q = load \"Beattie_Subs\";\nq = filter q by {{row(Tenure_Length_1.selection,[0],[\"min\",\"max\"]).asRange (\"Tenure\")}}; \nq_B = filter q by 'Churn' == \"Yes\";\nresult = group q by all full, q_B by all;\nresult = foreach result generate (count(q_B) / count(q))*100 as 'churnRate';",
I also have 2 additional labels in tenure length step, min an max:
"values": [
{
"display": "Low Risk",
"value": "1 to 12 months",
"min": 1,
"max": 12
},
{
"display": "Medium Risk",
"value": "1 to 12 months",
"min": 13,
"max": 24
},
{
"display": "High Risk",
"value": "1 to 12 months",
"min": 25,
"max": 36
}
filter q by {{row(Tenure_Length_1.selection, [0], [\"min\",\"max\"]).asRange(\"Tenure\")}};
as a filter to query and min/max.
I am getting following error in step3. where i need to add tenure length toggle .
And My Visual :
Query part:
"query": "q = load \"Beattie_Subs\";\r\nq = filter q by 'Tenure' in all;\r\nresult = filter q by 'Churn' == \"Yes\";\r\nresult = group result by all;\r\nresult = foreach result generate count() as 'count', count()*950 as attrCost;\r\nresult = limit result 2000;",
referenceLines->
"referenceLines": [
{
"color": "#E84340",
"label": "{{cell(Attrition_Cost_1.result, 0, \"attrCost\").asString()}}",
"value": "{{cell(Attrition_Cost_1.result, 0, \"attrCost\").asString()}}"
}
],
Please advise....
More binding needed, ;), and perhaps single quotes around attrcost, here´s my query for attrition_cost step:
"query": "q = load \"Beattie_Subs\";\r\nq= filter q by {{row(Tenure_Length_1.selection,[0],[\"min\",\"max\"]).asRange (\"Tenure\")}};\r\nq_B = filter q by 'Churn' == \"Yes\";\r\nresult = group q by all full, q_B by all;\r\nresult = foreach result generate count((q_B))*950 as 'attrCost';",
Apart from this, where did you locate referencelines?, I had some doubts regarding this, it worked for me putting reference tag in chart_4/chart_5 tags
Do you have any dumps or quiz related matterial for this certification(Salesforce Certified Einstein Analytics & Discovery Consultant (WI19))?
if you have, Please provide the details.
Thanks!!
I am stuck on Step #4 can someone help me with the names of the Steps? It seems that I have a misspelling somewhere.
Many thanks!
Did you add the reference in beattie survey chart?
Many thanks! I don't really know what caused the error but I signed in again, it was fixed. I've already finished the Superbadge.
Kind regards,
{
"type": "saql",
"query": "q = load \"Beattie_Subs\";\r\nq= filter q by {{row(Tenure_Length_1.selection,[0],[\"min\",\"max\"]).asRange (\"Tenure\")}};\r\nq_B = filter q by 'Churn' == \"Yes\";\r\nresult = group q by all full, q_B by all;\r\nresult = foreach result generate count((q_B))*950 as 'attrCost';",
"useGlobal": true,
"numbers": [],
"groups": [],
"strings": [],
"label": "Attrition Cost",
"visualizationParameters": {
"type": "chart",
"parameters": {
"visualizationType": "hbar",
"autoFitMode": "keepLabels",
"theme": "wave",
"title": {
"label": "",
"fontSize": 14,
"subtitleLabel": "",
"subtitleFontSize": 11,
"align": "center"
},
"referenceLines": [
{
"color": "#E84340",
"label": "{{cell(Attrition_Cost_1.result, 0, \"attrCost\").asString()}}",
"value": "{{cell(Attrition_Cost_1.result, 0, \"attrCost\").asString()}}"
}
],
"title": "Subscription Revenue",
"customDomain": {
"showDomain": false
q = load "Beattie_Subs";
cancel = group q by ('Churn_Date_Year', 'Churn_Date_Quarter');
cancel = foreach cancel generate cancel.'Churn_Date_Year' + "~~~" + cancel.'Churn_Date_Quarter' as 'ActivityDate_Year~~~ActivityDate_Quarter', count() as 'New Quarter Cancellations';
cancel = group cancel by ('ActivityDate_Year~~~ActivityDate_Quarter');
cancel = foreach cancel generate cancel.'ActivityDate_Year~~~ActivityDate_Quarter' as 'ActivityDate_Year~~~ActivityDate_Quarter', coalesce(sum(cancel.'New Quarter Cancellations'),0) as 'New Quarter Cancellations', coalesce(sum(sum('New Quarter Cancellations')) over ([-1..-1] partition by all order by ('ActivityDate_Year~~~ActivityDate_Quarter')),0) as 'Previous Quarter Cancellations';
As you can see the data skips quarter 2017-1.
cancel = foreach cancel generate cancel.'Churn_Date_Year' + "~~~" + cancel.'Churn_Date_Quarter' as 'ActivityDate_Year~~~ActivityDate_Quarter', count() as 'New Quarter Cancellations';
cancel = group cancel by ('ActivityDate_Year~~~ActivityDate_Quarter');
"cancel" now contains a row for each Quarter someone churned, but it doesn't have a row for Quarter w/o chruned subscribers.
What you'd need is one stream (e.g. "active") that contains all subscribers per unit of time, while cancel contains churned subscribers per unit of time. If you cogroup both now on quarters, coalesce would set rows to zero where there are active scubscribers but no chruned subscribers. But as you don't have the date information for quarter without churned subscribers, there's no row count and not even a row. so coalesce won't have an effect
Did you got it?, your json is exactly the same as mine´s
If not, I would face one error at a time, leave/delete the reference line for now and check if the binding it´s not working in the user interface.
I apologize, what I told you is a non sense
I got stuck at Step 1 with a weird EM :
The query is there, the field is created (with the name Churn Rate), the chart displays correctly, the dashboard is saved. I deleted my dashboard and started over, I received the same error, I created a brand new org, set up the dashboard again and received the same error. Finally, I reached out to Trailhead Support and they directed me to this thread.
Would anyone be able to give me a hand? I would really like to continue with this Superbadge.. Thanks in advance!
Challenge Not yet complete... here's what's wrong:
We can't find your recommendation. Confirm a 'Predicted Tenure' recommendation exists.
Close errors.
What exactly I am missing here.
I am getting the same error while checking the chages.
Can you please help me with this. I am stuck with only the last step for this super badge.
I just finished the superbadge! The workaround is to go in the model manager and create a brand new model called Predicted Tenure. After that you should be able to complete the challenge.
I am also following the Analytics Insight Specialist superbadge and I am stuck in the Challenge 3. I did everything and can able to create the bar chart as follows that is similler to the expected one in the challenge. But I got the following error,
We can't confirm the Subscriber Revenue chart is filtering by the Tenure Length toggle. Confirm there's a binding that filters attrition costs displayed in the reference line.
Guys I'm so confused right now, I can't find Model Manager, can you please tell me if there is any permission that I'm missing? I reviewed everywhere and I can't resolve it :(
Thanks.
Do you have Einstein Discovery enabled? Also please verify if you have Einstein Plus Admin user permission enabled.
I tried create new modal, create new story and deploy modal, created custom setting record again, deleted and re-created trigger again... But still no luck facing same error 'Cannot find information related in the trigger. Please confirm object and integration name'.
Any help
I tried create new modal, create new story and deploy modal, created custom setting record again, deleted and re-created trigger again... But still no luck facing same error 'Cannot find information related in the trigger. Please confirm object and integration name'.
Any help
Please try to check what is going wrong in debug log.
<steps to check debug log>
1. open developer console
2. run verify step in trailhead
3. open log in developer console
4. use ctrl+p to open [Select Panels]
5. mark [Source] checkbox
<sample screen capture>
Regards,
LinThaw
step 1- using union worked for me however the chart looks weird, churn rate in negative anyone have any idea of any function which can turn negative value to positive?
q = load "Beattie_Subs";
q1 = group q by ('Subscription_Date_Year', 'Subscription_Date_Quarter');
q1 = foreach q1 generate 'Subscription_Date_Year' + "-" + 'Subscription_Date_Quarter' as 'ActivityDate_Year-ActivityDate_Quarter', sum(count()) over ([-1..0] partition by all order by (Subscription_Date_Year, Subscription_Date_Quarter)) as'current and previous sub';
q2 = group q by ('Churn_Date_Year', 'Churn_Date_Quarter');
q2 = foreach q2 generate 'Churn_Date_Year' + "-" + 'Churn_Date_Quarter' as 'ActivityDate_Year-ActivityDate_Quarter', count() as 'current cancellation', sum(count()) over([-1..-1] partition by all order by (Churn_Date_Year,Churn_Date_Quarter) ) as 'prev_cancellation' ;
q3= union q1,q2;
q3 = group q3 by ('ActivityDate_Year-ActivityDate_Quarter');
q3 = foreach q3 generate 'ActivityDate_Year-ActivityDate_Quarter' as ' subscriber activity',(coalesce(sum('current cancellation'),0)/( coalesce(sum('current and previous sub'),0) - coalesce(sum('prev_cancellation'),0) )) *100 as 'Churn_Rate';
After all regenerating Beattie Subs dataset, custom setting integration name 'Tenure', Process Builder and Trigger, still facing the issue.
I could see records getting updated by the trigger and populating the three Tenure field values., however challenge throws below error still.
We couldn’t find the correct information associated with Apex trigger named SetDealPrediction. Confirm the Salesforce object and integration name.
In the debug log transaction is as follows., i could not figure the not.
Please try to delete and re-created the trigger and custom setting.
If possible please switch to Lightning Experience before verify.
how many log file did you see after verify from Trailhead?
have you any workflow in your org?
did you complete all steps from business requirement?
Regards,
LinThaw
a) Log file is not generateing while verifying the challenge. The log file which posted for your reference, from when updating the subscriber record.
b) No, I do not have any workflows.
c) Yes I did complete steps from business requirement.
This challenges focus on Managed Package component, Trigger, Subscriber Object & Fields, and Custom Settings right., Everything looks good but still i face that issue.
I am once again done with Custom Settings & Apex Trigger delete and recreation.
Following are the components.
Gone to lightning experience before verifying the challenge.
Verify Challenge - Still No Luck for me.
Having same error as Vijay on Challenge 5, "We couldn’t find the correct information associated with Apex trigger named SetDealPrediction. Confirm the Salesforce object and integration name"
Recreating trigger and custom setting, as well as redeploying predictive model didn't help.
I am wondering if something went wrong and I need to start all over again from step 1
Hi @Peter Greenbaum 7 I am facing same issue. step names are right almost everything is as you have mentioned still face the error
Challenge Not yet complete... here's what's wrong:
We can't find the 'Churn Tenure" chart. Check the step name and spelling.
Close errors
Please help.
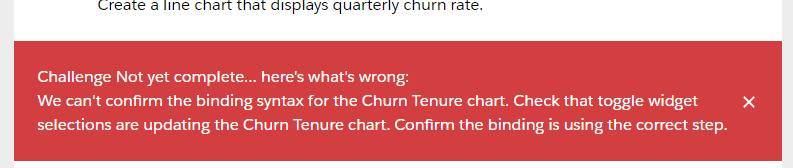
Challenge Not yet complete... here's what's wrong:
We can't confirm the binding syntax for the Churn Tenure chart. Check that toggle widget selections are updating the Churn Tenure chart. Confirm the binding is using the correct step.
Close errors
"Analytics encountered a problem with this step [churn_tenure].
Could not parse binding: Parse error on line1: ...th_1.selection,[0],[\"min\",\"max\"]).as ------------------^ Expecting 'INTEGER', '-', 'STRING', '}' got 'IDENTIFIER'."
Here's my code:
Tenure Length Static Step:
},
"Tenure_Length_1": {
"broadcastFacet": true,
"label": "Tenure Length",
"selectMode": "single",
"type": "staticflex",
"values": [
{
"display": "High Risk",
"value": "1 to 12 months",
"min": 1,
"max": 12
},
{
"display": "Medium Risk",
"value": "13 to 24 months",
"min": 13,
"max": 24
},
{
"display": "Low Risk",
"value": "25 to 36 months",
"min": 25,
"max": 36
}
]
Chart Tenure Step
q = load "Beattie_Subs";
q = filter q by {{row(Tenure_Length_1.selection,[0],[\"min\",\"max\"]).asRange(\"Tenure\")}};
q2 = filter q by 'Churn' == \"Yes\";
result = group q by all full, q2 by all;
result = foreach result generate (count(q2) / count(q))*100 as 'churnRate';
Any help would be appreciated!
Hi Josh,
In you dashboard JSON as you view the querry is the binding enclosed in "{{row(Tenure_Length_1.selection,[0],[\"min\",\"max\"]).asRange(\"Tenure\")}} " ?
If yes it might give the error expecting integer got string.
Hi Shantanu,
Do you mean is the binding enclosed in quotation marks? If that is your question, the answer is no. here is the dashboard JSON:
steps": {
"churn_tenure": {
"broadcastFacet": true,
"groups": [],
"label": "Churn Tenure",
"numbers": [],
"query": "q = load \"Beattie_Subs\";\nq = filter q by {{row(Tenure_Length_1.selection,[0],[\\\"min\\\",\\\"max\\\"]).asRange(\\\"Tenure\\\")}};q2 = filter q by 'Churn' == \"Yes\";\nresult = group q by all full, q2 by all;\nresult = foreach result generate (count(q2) / count(q))*100 as 'churnRate';",
Is this wrong?
"query": "q = load \"Beattie_Subs\";\nq = filter q by {{row(Tenure_Length_1.selection, [0], [\\\"min\\\",\\\"max\\\"]).asRange(\\\"Tenure\\\")}};q2 = filter q by 'Churn' == \"Yes\";\nresult = group q by all full, q2 by all;\nresult = foreach result generate (count(q2) / count(q))*100 as 'churnRate';",
I deleted them so that there was only one, and it worked fine. Any idea why the JSON might have done this? I certainly didn't put those extra slashes in, I just assumed at first it was something the JSON needed.
Anyway, solved :)
I completed all steps for Challenge 5 still seems to experience the attached error, can you help please?
I think you'll need to go to your story click the improvements tab and create another story with the name "predicted tenure". then create a data model through that story again naming "predicted tenure" and change the prediction id in the custom setting as well.
also in my case the fields tenure output etc are not getting populated like yours. what should i do for that.
I assumed that you followed this link (https://help.salesforce.com/articleView?id=bi_edd_wb_native.htm&type=5) to do all the prerequisite for this challenge. After creating the story with any name just click the drop down arrow button which is exist in right top corner. Click Deploy Model -> In the first screen just give the name 'predicted tenure' as Goal Title -> next screen select Subscriber object -> Map Fields -> No segment filter -> Add variable(Tick the variables) -> Reveiw -> Deploy.
It will work because that's what I did to overcome the exact issue you mentioned above
Anyone had an error "We couldn’t find the correct information associated with Apex trigger named SetDealPrediction. Confirm the Salesforce object and integration name" on the final step of the superbadge? And found a solution?
Please share)!
Appreciated,
Dmitry
I am stuck on this challenge more number of weeks.
We can't find the Subscriber Revenue step. Check step name and spelling. even though I have the step and the spelling is correct.
"markers": [ { "measure": "Beattie Survey", "row": [ "Illinois" ], "properties": { "backgroundColor": "#193F61", "borderColor": "#193F61", "measures": [ "Beattie Survey" ], "customText": [], "isBlinking": false, "defaultShow": true, "showDimensions": true, "showMeasures": true, "dimensions": [ "Region", "Avg_of_CSAT", "Avg_of_Tenure" ] } }, { "measure": "avg_CSAT", "row": [ "Illinois" ], "properties": { "backgroundColor": "#193F61", "borderColor": "#193F61", "measures": [ "avg_CSAT", "avg_Tenure" ], "customText": [], "isBlinking": false, "defaultShow": true, "showDimensions": true, "showMeasures": true, "dimensions": [ "Region" ] } }, { "measure": "avg_Tenure", "row": [ "Illinois" ], "properties": { "backgroundColor": "#193F61", "borderColor": "#193F61", "measures": [ "avg_CSAT", "avg_Tenure" ], "customText": [], "isBlinking": false, "defaultShow": true, "showDimensions": true, "showMeasures": true, "dimensions": [ "Region" ] } } ],I was just following the steps you mentioned..But still getting an error..Just check it out and help me with some solutions..
SOQL for Subcriber Revenue:
q = load "Beattie_Subs";
q = group q by 'Region';
q = foreach q generate 'Region' as 'Region', sum('Total_Charges') as 'Sum of Total Charges';
q = order q by 'Region' asc;
q = limit q 2000;
SOQL for Attrition Cost:
q = load "Beattie_Subs";
q = filter q by 'Tenure' in all;
result = filter q by 'Churn' == "Yes";
result = group result by all;
result = foreach result generate count() as 'count', count()*950 as attrCost;
result = limit result 2000;
Thank You
Saheli
We can't confirm the Subscriber Revenue chart is filtering by the Tenure Length toggle. Confirm there's a binding that filters attrition costs displayed in the reference line.
Any ideas?
Configuration of Write Back:
Error:
The Apex classes mentioned are managed so I'm unable to view the lines in question. This isn't as frustrating as thinking you have absolutely correct and not passing the challenge, but it is fairly aggravating to not know why something broke.
I'm Having the exact same issue here. Did you find any kind of solution / workaround ?
Does anyone have an idea why this might occur ?
Thanks in advance
Ilija did. I passed the certificaiton but it doesn't actually work.
While the bindings are okay:
And if we look at the step names, we can see this:
I've been working on this challenge for a couple of days now but can't complete step 2.
I am stuck with challenge 4. Here are the screenshots for the error and the charts.
Please let me know if anyone has come across with similar error.
This creates a ton of confusion for people looking for guidance on how to create dashboards intuitively without deep SAQL or SQL backgrounds.
For example: Step 1 in the superbadge is a challenge that seems to be all about understanding the windowing SAQL functions used to create the chart that creates a few of the subscriber activity. I was barely able to understand how to create this dataset from the responses on here, but eventually I got it. E.g. Some people are calling "Current quarter cancellations" as "New Quarter Cancellations" whihc is not how it is described in teh activity and in general the problem for me comes from the way people use developer lingo to describe their solutions and no one seems to comment their code which is really confusing to me.
q = load "Beattie_Subs"; -- Current Quarter Cancellations cancelled = group q by ('Churn_Date_Year', 'Churn_Date_Quarter'); cancelled = foreach cancelled generate cancelled.'Churn_Date_Year' + "~~~" + cancelled.'Churn_Date_Quarter' as 'ActivityDate_Year~~~ActivityDate_Quarter', count() as 'Current Quarter Cancellations'; -- New Quarter Subscribers subs = group q by ('Subscription_Date_Year', 'Subscription_Date_Quarter'); subs = foreach subs generate subs.'Subscription_Date_Year' + "~~~" + subs.'Subscription_Date_Quarter' as 'ActivityDate_Year~~~ActivityDate_Quarter', count() as 'New Quarter Subcribers'; -- Previous Quarter Subscribers subs = group subs by ('ActivityDate_Year~~~ActivityDate_Quarter'); subs = foreach subs generate subs.'ActivityDate_Year~~~ActivityDate_Quarter' as 'ActivityDate_Year~~~ActivityDate_Quarter', coalesce(sum(subs.'New Quarter Subcribers'),0) as 'New Quarter Subcribers', coalesce(sum(sum('New Quarter Subcribers')) over ([-1..-1] partition by all order by ('ActivityDate_Year~~~ActivityDate_Quarter')),0) as 'Previous Quarter Subcribers'; -- Previous Quarter Cancellations cancelled = group cancelled by ('ActivityDate_Year~~~ActivityDate_Quarter'); cancelled = foreach cancelled generate cancelled.'ActivityDate_Year~~~ActivityDate_Quarter' as 'ActivityDate_Year~~~ActivityDate_Quarter', coalesce(sum(cancelled.'Current Quarter Cancellations'),0) as 'Current Quarter Cancellations', coalesce(sum(sum('Current Quarter Cancellations')) over ([-1..-1] partition by all order by ('ActivityDate_Year~~~ActivityDate_Quarter')),0) as 'Previous Quarter Cancellations'; -- Churn Rate is Current Quarter Cancellations / (New Quarter Subscribers + Previous Quarter Subscribers - Previous Quarter Cancellations) resultchurn = cogroup subs by 'ActivityDate_Year~~~ActivityDate_Quarter' full, cancelled by 'ActivityDate_Year~~~ActivityDate_Quarter'; resultchurn = foreach resultchurn generate coalesce(subs.'ActivityDate_Year~~~ActivityDate_Quarter', cancelled.'ActivityDate_Year~~~ActivityDate_Quarter') as 'ActivityDate_Year~~~ActivityDate_Quarter', sum(cancelled.'Current Quarter Cancellations')/(sum(subs.'New Quarter Subcribers') + sum(subs.'Previous Quarter Subcribers') - sum(cancelled.'Previous Quarter Cancellations')) as 'Churn Rate';Now I am definitely stuck on Step 2 and I would like to know how the Dashboard tools are intended to be used, not how you can use SAQL and JSON to force the solutions into the validation checker to complete the step.
Here’s my question:
Using the toggle from the Dashboard tools, how exactly does one define a custom query with user defined values (which is also called a static step I think)
It would seem that you define the filters like this
Note:
I have researched this topic and there’s very little guidance on trailblazer community KB for this Create a Custom Query with User-Defined Values (https://help.salesforce.com/articleView?id=bi_dashboard_steps_custom_flex.htm&type=5) its also very poorly described in the developer bindings guide on page 35 (https://resources.docs.salesforce.com/222/latest/en-us/sfdc/pdf/bi_dev_guide_bindings.pdf)
With that said I hope someone can help this non developer understand how to use these great tools.
Please help I am stucked on this step
above is the step i have done till now
Tried various combinations to get rid of this error, but couldn't eradicate. What am I missing here?
We can't find a 'Churn Rate' step. Confirm the step name and spelling.
Here is my code:
q = load "Beattie_Subs"; cancel = group q by ('Churn_Date_Year', 'Churn_Date_Quarter'); cancel = foreach cancel generate cancel.'Churn_Date_Year' + "~~~" + cancel.'Churn_Date_Quarter' as 'ActivityDate_Year~~~ActivityDate_Quarter', count() as 'New Quarter Cancellations'; cancel = group cancel by ('ActivityDate_Year~~~ActivityDate_Quarter'); cancel = foreach cancel generate cancel.'ActivityDate_Year~~~ActivityDate_Quarter' as 'ActivityDate_Year~~~ActivityDate_Quarter', coalesce(sum(cancel.'New Quarter Cancellations'),0) as 'New Quarter Cancellations', coalesce(sum(sum('New Quarter Cancellations')) over ([-1..-1] partition by all order by ('ActivityDate_Year~~~ActivityDate_Quarter')),0) as 'Previous Quarter Cancellations'; sub = group q by ('Subscription_Date_Year', 'Subscription_Date_Quarter'); sub = foreach sub generate sub.'Subscription_Date_Year' + "~~~" + sub.'Subscription_Date_Quarter' as 'ActivityDate_Year~~~ActivityDate_Quarter', count() as 'New Quarter Subcribers'; sub = group sub by ('ActivityDate_Year~~~ActivityDate_Quarter'); sub = foreach sub generate sub.'ActivityDate_Year~~~ActivityDate_Quarter' as 'ActivityDate_Year~~~ActivityDate_Quarter', coalesce(sum(sub.'New Quarter Subcribers'),0) as 'New Quarter Subcribers', coalesce(sum(sum('New Quarter Subcribers')) over ([-1..0] partition by all order by ('ActivityDate_Year~~~ActivityDate_Quarter')),0) as 'Previous Quarter Subcribers'; result = cogroup sub by 'ActivityDate_Year~~~ActivityDate_Quarter' full, cancel by 'ActivityDate_Year~~~ActivityDate_Quarter'; result = foreach result generate coalesce(sub.'ActivityDate_Year~~~ActivityDate_Quarter', cancel.'ActivityDate_Year~~~ActivityDate_Quarter') as 'ActivityDate_Year~~~ActivityDate_Quarter', sum(cancel.'New Quarter Cancellations')/(sum(sub.'New Quarter Subcribers') + sum(sub.'Previous Quarter Subcribers') - sum(cancel.'Previous Quarter Cancellations')) as 'Churn Rate';Thanks,
Pramod V
When I go to Setup and type 'develop' in the search box, nothing comes up. So I looked for 'Custom Settings' and that brought up a page, but there are no listings. Not sure where to go from here, any suggestions?
Regards,
Thats is because you have to install the Einstein Discovery Prediction package before, then go to Setup -> Custom Settings and right there is going to show you the "Einstein Discovery - Write Back" record, where you can edit and manage it. From there is where you have to follow the steps written by LinThaw in this thread above but still i can't complete the challenge because is show me the bellow error: "Challenge Not yet complete... here's what's wrong:
We couldn’t find the correct information associated with Apex trigger named SetDealPrediction. Confirm the Salesforce object and integration name." I think i am not able to call ed_insights from the trigger and i don't know why... Some help?
I am getting this error
"Challenge Not yet complete... here's what's wrong:
We can't confirm this is the state with the lowest CSAT or we couldn't find your result. Make sure a marker was added to your chart. Evaluate how the two datasets were grouped, and which fields were used. Also, confirm the chart is sorted by CSAT in ascending order.
Close errors"
I have done till the treemap chart,how to do the next steps
and I thank one and all for providing steps with explaination,it has helped immensly atleast till now!
Error:
Challenge Not yet complete... here's what's wrong:
We couldn’t find the correct information associated with Apex trigger named SetDealPrediction. Confirm the Salesforce object and integration name.
All is working, when editing a Subscriber record the fields get values.
I am Struck at Step 2 of Einstein Analytics and Discovery Insights Specialist.I am new to the binding concepts and I am not able to understanad what should we do next .I have created a rating chart calculating Churn/total no of Subscribers .Please help me from this step.
I need some help with the challenge 3, I'm stuck trying to validate it
I have created each of the required steps as follows, including the bars chart, and the reference line which depends on the Attrition Cost step
As you could see, my attrition cost step contains the binding controlled by the static step with the risks.
It works, in fact when I run the dashboard and click on the toggle step, the value in the reference line changes and it moves through the bars. That's why I consider It is enough.
Trying to complete the challenge, I got the error message "Challenge Not yet complete... here's what's wrong:
We can't confirm the chart reference lines have the correct label and value. The reference line has to have attrition costs as its label and value, plus filter by the Tenure Length toggle."
I read in some forums that the json of the line reference should be modified too (Don´t understand why if the binding works), also I see that the structure of my reference line is different that the ones the people suggest. So I don't know where the binding must be located
Could you plese guide me and explain me the process? or indicate me what I am missing?
Thanks a lot
Hi Everyone, I am stuck on Step One but I am not sure if its because of a change on Salesforce Analytics Dashboards....
I know that recently Einstein Analytics changed "Step" for Query. When I attempt Challenge 1 I am getting the following error even though I followed what others have done successfully...
This is the Error Messge
Challenge Not yet complete... here's what's wrong:
We can't find a 'Churn Rate' step. Confirm the step name and spelling.
Can someone tell me if they have been able to clear Step One after it was changed to Query?
I would highly appreciate your feedback as I think its a bug from Trailhead.
Thank you
PEDRO
PS: I also tried to create another org but noticed that when I switch to Analytics it will go to my original org.... so i could not test this on a second environment
The binding should be located in the Label and the Value of the Reference Line.
hi . I have been reviewing the step 1 in the superbadge after passing it with the help of the people here. I do think there might be an issue with some of the solutions here even thoiugh it passed the SF review (ie given the 500 pts for step 1) In most of these solutions, the churn rate only is calculated when there are actual cancellations for the quarter because the numerator is not zero. However, if you explore the dataset,there are 61 cancellations in q4-2016. This means that there ought to be a churn rate on q4-2016 BUT in the codes posted here the churn rate is null. Can anyone help me. I have been at this for days. Thanks.
i have started the Superbadge and i am facing this error which is 'we cant't find "churn rate"' . Please help me in clearing this error.
Attrition Cost Code:
q = load "Beattie_Subs";
q = filter q by 'Tenure' >= 0 && 'Tenure' <= 100;
q_B = filter q by 'Churn' == "Yes";
result = group q by all full, q_B by all;
result = foreach result generate count((q_B))*950 as 'attrCost';
On the step 4, i am trying to facet the treemap chart on selections from the pyramid chart and i am a stil stuck.
I tried this in OEM step:
q = load "Beattie_OEM_Survey";
s = load "Beattie_Subs";
q = group q by 'OEM';
q = filter q by {{column(Beattie_Survey_1.selection, [\"Region\"])).asEquality(\"Region\")}};
q = foreach q generate 'OEM' as 'OEM', count() as 'count';
q = order q by 'OEM' asc;
but this line seems to be not ok since I cannot upate the query or save it,
q = filter q by {{column(Beattie_Survey_1.selection, [\"Region\"])).asEquality(\"Region\")}};
Have you any ideas please?
Kind regards,
I am stuck with challenge (step 2). I am trying all the solutions provided but it is still incomplete. The query I am using is -
q = load \"Beattie_Subs\";\n
q = filter q by {{row(Tenure_Length.selection, [0], [\"min\",\"max\"]).asRange(\"Tenure\")}};\n
q_B = filter q by 'Churn' == \"Yes\";\n
result = group q by all full, q_B by all;\n
result = foreach result generate (count(q_B)/ count(q))*100 as 'churnRate';
but this is not working for me. Could anybody help me please for this.
I am getting this error on Challenge 5 . Can anyone please help me with this. Is there any trick while creating story. I tried it multiple times with different orgs. But it still get fails. If I am missing anyhting then please let me know.
Steps I followed:-
Anyhelp would be highly appreciated.
I am getting an error in step 3:
We can't find the Subscriber Revenue step. Check step name and spelling.
Close errors
I don't know why this is getting!
My Reference line code is:
"referenceLines": [
{
"color": "#B50E03",
"label": {
"data": "{{cell(Attrition_Cost_2.result, 0, \"attrCost\").asString()}}",
"type": "static"
},
"value": {
"data": "{{cell(Attrition_Cost_2.result, 0, \"attrCost\").asString()}}",
"type": "static"
}
}
],
Attrition Cost:
q = load "Beattie_Subs";
q = filter q by 'Tenure' in all;
result = filter q by 'Churn' == "Yes";
result = group result by all;
result = foreach result generate count() as 'count', count()*950 as attrCost;
result = limit result 2000;
Please help me with this.
How to bind toggle widget section are updating the Churn Tenure chart. Please let me know.
It all depends on your code.
Please post your code for:
SAQL or JSON Query for your Churn Rate
JSON for Tenure_Length toggle widget
then I can recommend what you need to do.
Basically, you need to replace the filter by 'Tenure' in your JSON under your Churn_Tenure query with something like this:
"query": "q = load \"Beattie_Subs\";\nq = filter q by {{row(Tenure_Length_1.selection,[0],[\"min\",\"max\"]).asRange (\"Tenure\")}}; \nq_B = filter q by 'Churn' == \"Yes\";\nresult = group q by all full, q_B by all;\nresult = foreach result generate (count(q_B) / count(q))*100 as 'churnRate';",
But it depends on how you built your Tenure_Length toggle widget...
Did you resolve your problem? Did you create a query named "Subscriber Revenue"?
If yes, you don't really need to change the code in your JSON to set up the reference line.
You can set it up with these settings (see below) and that should connect your Attrition_Cost to the Reference Line
He won't let me install the Einstein Discovery WriteBack package
How did you get it installed?
When I open the link from https://help.salesforce.com/articleView?id=bi_edd_wb_install_native.htm&type=5 it always asks me to log out and log in.
And when I log in from Salesforce, I get blocked when checking the account.
Open the link in an incognito browser. Log-in with the same trailhead account you are using for this superbadge. And remember to "INSTALL FOR ADMINS ONLY".
I'm still making the same mistake.
Every time I open the link and log in, when I push Get it Now it always comes out "You need a Salesforce account
Already have an account? Log out of AppExchange. Log in to AppExchange with your Salesforce credentials and install the package in your org. Only admins can install products from AppExchange, so ask your admin if you need help."
If yes, make sure you are logging in using the USERNAME shown in your trailhead Einstein Developer account which you used to pass steps 1 - 4.
I do remember that it is recommended get and install packages from incognito browsers. If it still does not work, I think you might want to try another browser (such as firefox)?
Thanks!!
My problem was that i did log in with my email and not with my username.
The solution is actually much simpler. No need to change JSON.
Below is the SAQL for the chart on the left:
oem = load "Beattie_OEM_Survey";
subs = load "Beattie_Subs";
q = cogroup oem by ('Region', 'Account_Manager'), subs by ('Region', 'Account_Manager');
q = foreach q generate oem.'Region' as 'Region', round(avg(oem.'CSAT')) as 'avg_CSAT', round(avg(subs.'Tenure')) as 'avg_Tenure';
q = order q by 'avg_CSAT' asc;
Below is the SAQL for the chart on the right:
q = load "Beattie_OEM_Survey";
q = group q by 'OEM';
q = foreach q generate 'OEM' as 'OEM', count() as 'count';
q = order q by 'OEM' asc;
q = limit q 2000;
THEN IN ORDER TO FACET, all you need to do is to clicks on the left chart; then click on QUERY (see picture below) and set these settings.
Do the same thing for the OEM chart. Click on the OEM chart, click on QUERY and set the faceting the same way.
For step 5, I also encountered issues but I debugged it using the developer's console. To be brief, I set up my writeback incorrectly, I typed: Subscriber as my object. The correct entry should be Subscriber__c
I was then able to edit Cancelled Subscribers and the Predicted Tenure, explanation, etc. were automatically put into the Cancelled Subscriber's Tenure fields.
I also passed Step 5 and got another superbadge.
Anyway, below is a checklist of what you might want to check if you are getting errors in Step 5.
Checklist:
1. Did you deploy your model and when you look at Model Manager, do you see the Prediction that was created from deploying your Model?
2. Did you also set your Prediction Setting to "No prediction field"?
3. Is your writeback's Tenure / Prediction Definition ID showing the same ID as shown when you look at the URL of your Prediction Name?
4. Is your Apex Trigger like this?
trigger SetDealPrediction on Subscriber__c (after insert, after update) {
if(System.isFuture()) return;
if(ed_insights.CheckRecursive.runOnce()) {
// custom Settings' name
String CONFIG_NAME = 'Tenure';
ed_insights.TriggerHandler.insertUpdateHandle(CONFIG_NAME);
}
}
5. Is your Process Flow like this and is it activated?
6. Then, Editing a cancelled Subscribing should result to this:
I am stuck at Einstein Analytics and Discovery Insights Specialist: Challenge 2. I am trying to bind “Tenure_Length_1” and “Churn_Tenure_1”. I am getting issue when I modified “Churn_Tenure_1” Step by the below Query. The query is not running it is showing loading image.
q = load "Beattie_Subs"; q = filter q by {{row(Tenure_Length_1.selection, [0], [\"min\",\"max\"]).asRange(\"Tenure\")}}; q_B = filter q by 'Churn' == \"Yes\"; result = group q by all full, q_B by all; result = foreach result generate (count(q_B)/ count(q))*100 as 'churnRate';Tenure_Length_1 JSON :
{ "broadcastFacet": true, "columns": {}, "label": "Tenure Length", "selectMode": "single", "type": "staticflex", "values": [ { "display": "High Risk", "value": "1 to 12 months", "min": 1, "max": 12 }, { "display": "Medium Risk", "value": "13 to 24 months", "min": 13, "max": 24 }, { "display": "Low Risk", "value": "25 to 36 months", "min": 25, "max": 36 } ], "numbers": [], "strings": [], "groups": [] }Thanks,
Rajib.
You may revise your SAQL from:
q = filter q by {{row(Tenure_Length_1.selection, [0], [\"min\",\"max\"]).asRange(\"Tenure\")}};
q_B = filter q by 'Churn' == \"Yes\";
to:
q = filter q by 'Tenure' >= 0 && 'Tenure' <= 100;
q_B = filter q by 'Churn' == "Yes";
THEN, the way you bind is through the JSON. You should look at the query code under "Churn_Tenure_1 in your JSON. The query should show something similar, especifically this: {{row(Tenure_Length_1.selection,[0],[\"min\",\"max\"]).asRange (\"Tenure\")}}
Mine looks like this:
"Churn_Tenure_1": {
"broadcastFacet": true,
"groups": [],
"label": "Churn Tenure",
"numbers": [],
"query": "q = load \"Beattie_Subs\";\nq = filter q by {{row(Tenure_Length_1.selection,[0],[\"min\",\"max\"]).asRange (\"Tenure\")}};\nq_B = filter q by 'Churn' == \"Yes\";\nresult = group q by all full, q_B by all;\nresult = foreach result generate (count(q_B) / count(q))*100 as 'churnRate';",
"receiveFacetSource": {
"mode": "all",
"steps": []
},
It should then work. Please upvote if this answer helps you.
I have completed Challenge 2.
I am stuck at Einstein Analytics and Discovery Insights Specialist: Challenge 3. Showing error message when I am trying to save Dashnoard, after adding reference line. Please help me.
Attrition_Cost_1 JSON :
...... "groups": [], "label": "Attrition Cost", "numbers": [], "query": "q = load \"Beattie_Subs\";\r\nq = filter q by {{row(Tenure_Length_1.selection,[0],[\"min\",\"max\"]).asRange (\"Tenure\")}};\nresult = filter q by 'Churn' == \"Yes\";\r\nresult = group result by all;\r\nresult = foreach result generate count() as 'count', count()*950 as attrCost;\r\nresult = limit result 2000;", "receiveFacetSource": { "mode": "all", "steps": [] }, .....Reference Lines JSON:
{ "parameters": { "autoFitMode": "keepLabels", "showValues": true, "bins": { "breakpoints": { "high": 100, "low": 0 }, "bands": { "high": { "color": "#008000", "label": "" }, "low": { "color": "#B22222", "label": "" }, "medium": { "color": "#ffa500", "label": "" } } }, "legend": { "descOrder": false, "showHeader": true, "show": true, "customSize": "auto", "position": "right-top", "inside": false }, "axisMode": "multi", "tooltip": { "showBinLabel": true, "measures": "", "showNullValues": true, "showPercentage": true, "showDimensions": true, "showMeasures": true, "customizeTooltip": false, "dimensions": "" }, "visualizationType": "hbar", "exploreLink": true, "title": { "fontSize": 14, "subtitleFontSize": 11, "label": "", "align": "center", "subtitleLabel": "" }, "binValues": false, "trellis": { "flipLabels": false, "showGridLines": true, "size": [ 100, 100 ], "enable": false, "type": "x", "chartsPerLine": 4 }, "showActionMenu": true, "measureAxis2": { "sqrtScale": false, "showTitle": true, "showAxis": true, "title": "", "customDomain": { "showDomain": false } }, "measureAxis1": { "sqrtScale": false, "showTitle": true, "showAxis": true, "title": "", "customDomain": { "showDomain": false }, "referenceLines": [ { "color": "#E84340", "label": "{{cell(Attrition_Cost_1.result,0,\"attrCost\").asString()}}", "value": "{{cell(Attrition_Cost_1.result,0,\"attrCost\").asString()}}" } ] }, "theme": "wave", "step": "Subscriber_Revenue_1", "dimensionAxis": { "showTitle": true, "customSize": "auto", "showAxis": true, "title": "", "icons": { "useIcons": false, "iconProps": { "fit": "cover", "column": "", "type": "round" } } }, "applyConditionalFormatting": true }, "type": "chart" }Subscriber_Revenue_1 JSON:
.................. "broadcastFacet": true, "groups": [], "label": "Subscriber Revenue", "numbers": [], "query": "q = load \"Beattie_Subs\";\r\nq = group q by 'Region';\r\nq = foreach q generate 'Region' as 'Region', sum('Total_Charges') as 'Sum of Total Charges';\r\nq = order q by 'Region' asc;\r\nq = limit q 2000;", "receiveFacetSource": { "mode": "all", "steps": [] }, ..........Dashboard is workinng with Toggle :
Thanks,
Rajib.
Please look for my post of April 9, 2020 to @Mallika Bannaravuri 17.
I posted this:
"You don't need to change your JSON to set up the reference line. You can set it up with these settings (see picture I shared on 9 April) and that should connect your Attrition_Cost to the Reference Line"
It works!
I followed your steps to facet both charts. I updated the second one too with the same properties but the faceting only wok on way. If i select something on the second one it will facet he first one, but if select a bar in the first one, the second one is not updated.
First diagnosis would be that there might be something wrong with your query for the left chart. You need to cogroup. Below is your query; then below that is my query:
Your query:
q = load "Beattie_OEM_Survey";
s = load "Beattie_Subs";
q = group q by 'OEM';
q = filter q by {{column(Beattie_Survey_1.selection, [\"Region\"])).asEquality(\"Region\")}};
q = foreach q generate 'OEM' as 'OEM', count() as 'count';
q = order q by 'OEM' asc;
My queries:
Below is the SAQL for the chart on the left:
oem = load "Beattie_OEM_Survey";
subs = load "Beattie_Subs";
q = cogroup oem by ('Region', 'Account_Manager'), subs by ('Region', 'Account_Manager');
q = foreach q generate oem.'Region' as 'Region', round(avg(oem.'CSAT')) as 'avg_CSAT', round(avg(subs.'Tenure')) as 'avg_Tenure';
q = order q by 'avg_CSAT' asc;
Below is the SAQL for the chart on the right:
q = load "Beattie_OEM_Survey";
q = group q by 'OEM';
q = foreach q generate 'OEM' as 'OEM', count() as 'count';
q = order q by 'OEM' asc;
q = limit q 2000;
Hi @Marite Ferrero,
Indead, my two queries were:
q = load "Beattie_Subs";
s = load "Beattie_OEM_Survey";
r = cogroup q by 'Region', s by 'Region';
r = foreach r generate s.'Region' as 'Region', round(avg(s.CSAT),0) as 'avg_CSAT', round(avg(q.'Tenure'),0) as 'avg_Tenure';
r = order r by 'avg_CSAT' asc;
and
q = load "Beattie_OEM_Survey";
s = load "Beattie_Subs";
q = group q by 'OEM';
q = foreach q generate 'OEM' as 'OEM', count() as 'count';
q = order q by 'OEM' asc;
q = limit q 2000;
Using yours in my first chart works, and when i select a bar, the second chart is faceted. But when i try just to adapt my query in first chart, with my notations, and yours, it doesn't work. I investigated but can't find why, maybe you would have an idea? Thank you for your help.
(I tried to add, the cogroup with the Account Manager as you did, i tried to rename some elements but i cannot see why it doesn't work.)
Without seeing your JSON for these 2 charts, the only other difference I see is that your code does not deploy the 2 lines of requirement which are:
- Beattie Media’s Account Managers are assigned to an OEM partner and oversees the relationship.
- Group the datasets using the Account Manager and Region fields.
Your cogroup is only against Region:r = cogroup q by 'Region', s by 'Region';
while this is my cogroup:
q = cogroup oem by ('Region', 'Account_Manager'), subs by ('Region', 'Account_Manager');
The link between the 2 datasets (2 charts) is based on both Region and Account Manager.
Challenge Not yet complete... here's what's wrong:
We can't confirm the binding syntax for the Churn Tenure chart. Check that toggle widget selections are updating the Churn Tenure chart. Confirm the binding is using the correct step
Thanks
Did you check my April 12, 2020 post to Rajib Kumar Maity for Challenge 2?
Thank You
At validation I get the following error message:
This is how it looks like on my Dashboard:
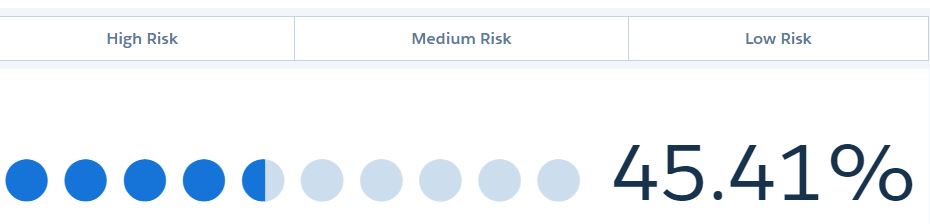
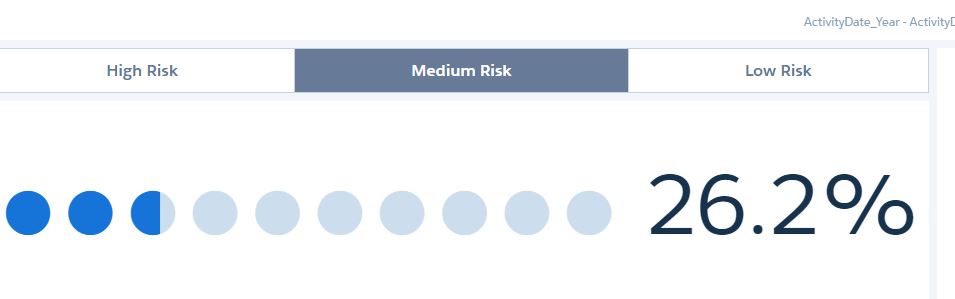
The chart seems to be correct, but the toggle doesn't. Nothing happens when clicking on "High Risk", "Medium Risk", "Low Risk":
This is my Query for Churn Tenure: This is my Query for Tenure Length:
{ "broadcastFacet": true, "columns": {}, "label": "Tenure Length", "selectMode": "single", "type": "staticflex", "values": [ { "display": "High Risk", "value": "1 to 12 months", "min": 1, "max": 12 }, { "display": "Medium Risk", "value": "13 to 24 months", "min": 13, "max": 24 }, { "display": "Low Risk", "value": "25 to 36 months", "min": 25, "max": 36 } ], "numbers": [], "strings": [], "groups": [] }Those are the names of my different Queries:
Tenure Length:
Anyone who sees what I'm missing?
Thank you!
You need to implement the BIND in your JSON. You need to replace the Filter of your query for your chart in order for toggle to work.
Please check my April 12, 2020 post to Rajib Kumar Maity for Challenge 2.
Thank you for your prompt answer! I've implemented the BIND in my JSON, by replacing the "old" filter by {{row(Tenure_Length_1.selection,[0],[\"min\",\"max\"]).asRange (\"Tenure\")}}. However, my chart is not displaying now, I get an error when trying to edit it, and my Query has also "disappeared" from tle list:
This is my chart and I believe that T had done some mistake because output is different as compared other one's and trailhead chart.
I think there is no filter of tenure and I don't recognize if there is filter then what is criteria?
Here is my JSON of Subscribe Revenue.
{ "parameters": { "autoFitMode": "keepLabels", "showValues": true, "bins": { "breakpoints": { "high": 100, "low": 0 }, "bands": { "high": { "color": "#008000", "label": "" }, "low": { "color": "#B22222", "label": "" }, "medium": { "color": "#ffa500", "label": "" } } }, "legend": { "descOrder": false, "showHeader": true, "show": true, "customSize": "auto", "position": "right-top", "inside": false }, "axisMode": "multi", "tooltip": { "showBinLabel": true, "measures": "", "showNullValues": true, "showPercentage": true, "showDimensions": true, "showMeasures": true, "customizeTooltip": false, "dimensions": "" }, "visualizationType": "hbar", "title": { "fontSize": 14, "subtitleFontSize": 11, "label": "", "align": "center", "subtitleLabel": "" }, "binValues": false, "trellis": { "flipLabels": false, "showGridLines": true, "size": [ 100, 100 ], "enable": false, "type": "x", "chartsPerLine": 4 }, "columnMap": { "trellis": [], "dimensionAxis": [ "Region" ], "plots": [ "sum_Total_Charges" ] }, "showActionMenu": true, "measureAxis2": { "sqrtScale": false, "showTitle": true, "showAxis": true, "title": "", "customDomain": { "showDomain": false } }, "measureAxis1": { "sqrtScale": false, "showTitle": true, "showAxis": true, "referenceLines": [ { "color": "#B50E03", "label": { "data": "{{cell(Attrition_Cost_1.result, 0, \"attrCost\").asString()}}", "type": "static" }, "value": { "data": "{{cell(Attrition_Cost_1.result, 0, \"attrCost\").asString()}}", "type": "static" } } ], "title": "", "customDomain": { "showDomain": false } }, "theme": "wave", "step": "Subscriber_Revenue_1", "dimensionAxis": { "showTitle": true, "customSize": "auto", "showAxis": true, "title": "", "icons": { "useIcons": false, "iconProps": { "fit": "cover", "column": "", "type": "round" } } }, "applyConditionalFormatting": true, "exploreLink": true }, "type": "chart" }Here is my Query of Attrition Cost
And if I put following filter in the query and I run it, it doesn't respond
q = filter q by {{row(Tenure_Length_1.selection,[0],[\"min\",\"max\"]).asRange (\"Tenure\")}};And Here is my Tenure Toggle Query.
{ "broadcastFacet": true, "columns": {}, "label": "Tenure Length", "selectMode": "single", "type": "staticflex", "values": [ { "display": "High Risk", "value": "1 to 12 months" }, { "display": "Medium Risk", "value": "13 to 24 months" }, { "display": "Low Risk", "value": "25 to 36 months" } ], "numbers": [], "strings": [], "groups": [] }Don't know what mistake I did?
Please Help
Thanks in Advance
Dharmesh
Your filters come from the chart on the left side.
You need to implement the BIND in your JSON. You need to replace the Filter of your query for your chart in order for toggle to work.
Please check my April 12, 2020 post to Rajib Kumar Maity for Challenge 2. It shows what and where you need to place the BIND.
I am not stuck at Challenge 2 I am stuck at Challenge 3
For step 3, please check my post to Mallika Bannaravuri 17 on April 9, 2020. You don't need to change your JSON for Attrition.
My post on April 9, 2020 explains it.
q = load "Beattie_Subs";
q = group q by 'Region';
q = foreach q generate 'Region' as 'Region', sum('Total_Charges') as 'sum_Total_Charges';
q = order q by 'Region' asc;
q = limit q 2000;
It translates into this JSON:
"Subscriber_Revenue_1": {
"broadcastFacet": true,
"groups": [],
"label": "Subscriber Revenue",
"numbers": [],
"query": "q = load \"Beattie_Subs\";\nq = group q by 'Region';\nq = foreach q generate 'Region' as 'Region', sum('Total_Charges') as 'sum_Total_Charges';\nq = order q by 'Region' asc;\nq = limit q 2000;",
"receiveFacetSource": {
"mode": "all",
"steps": []
},
"selectMode": "single",
"start": [],
"strings": [],
"type": "saql",
"useGlobal": true,
------- This is the JSON for Attrition_Cost (But like I said in my previous post, you don't need to touch the JSON for the Attrition_Cost - You just need to set it up in the chart itself
"Attrition_Cost_1": {
"broadcastFacet": true,
"groups": [],
"label": "Attrition Cost",
"numbers": [],
"query": "q = load \"Beattie_Subs\";\nq_A = filter q by {{row(Tenure_Length_1.selection,[0],[\"min\",\"max\"]).asRange (\"Tenure\")}} && 'Churn' == \"Yes\";\nresult = group q_A by all;\nresult = foreach result generate count(q_A) as 'A';\nresult = foreach result generate 'A', A*950.00 as 'attrCost';\nresult = limit result 2000;\n",
"receiveFacetSource": {
"mode": "all",
"steps": []
},
"selectMode": "single",
"strings": [],
"type": "saql",
"useGlobal": true,
Please mark this if it helps you, so the next person can also use it. Thanks.
Don't know why this error came?
q = load "Beattie_Subs";
q_A = filter q by
'Tenure'>= 0&& 'Tenure'<= 100&& 'Churn' == “Yes”;result = group q_A by all;
result = foreach result generate count(q_A) as 'A';
result = foreach result generate 'A', A*950.00 as 'attrCost';
result = limit result 2000;
"referenceLines": [
088 {
089 "color": "#B50E03",
090 "label": {
091 "data": "{{cell(Attrition_Cost_1.result, 0, \"attrCost\").asString()}}",
092 "type": "static"
093 },
094 "value": {
095 "data": "{{cell(Attrition_Cost_1.result, 0, \"attrCost\").asString()}}",
096 "type": "static"
097 }
098 }
099 ],
AFTER you changed it so that you bound the reference line to Attrition_Cost via the chart, your JSON should now look like this:
"referenceLines": [
{
"color": "#E74340",
"label": {
"data": {
"displayTemplate": "[attrCost]",
"sourceType": "result",
"step": "Attrition_Cost_1"
},
"type": "dynamic"
},
"value": {
"data": {
"field": "attrCost",
"sourceType": "result",
"step": "Attrition_Cost_1"
},
"type": "dynamic"
}
}
],
Again Error after update JSON of Reference Line
Attrition Cost
Subscription Revenue
and
Reference Line
"query": "q = load \"Beattie_Subs\";\nq_A = filter q by {{row(Tenure_Length_1.selection,[0],[\"min\",\"max\"]).asRange (\"Tenure\")}} && 'Churn' == \"Yes\";\nresult = group q_A by all;\nresult = foreach result generate count(q_A) as 'A';\nresult = foreach result generate 'A', A*950.00 as 'attrCost';\nresult = limit result 2000;\n",
Attrition Cost JSON
{ "type": "saql", "query": "q = load \"Beattie_Subs\";\r\nq_A = filter q by 'Tenure' >= 0 && 'Tenure' <= 100 && 'Churn' == \"Yes\";\r\nresult = group q_A by all;\r\nresult = foreach result generate count(q_A) as 'A';\r\nresult = foreach result generate 'A', A*950.00 as 'attrCost';\r\nresult = limit result 2000;", "groups": [], "label": "Attrition Cost", "numbers": [], "strings": [], "useGlobal": true, "visualizationParameters": { "parameters": { "visualizationType": "hbar", "autoFitMode": "keepLabels", "theme": "wave", "title": { "label": "", "fontSize": 14, "subtitleLabel": "", "subtitleFontSize": 11, "align": "center" }, "showValues": true, "axisMode": "multi", "binValues": false, "bins": { "breakpoints": { "low": 0, "high": 100 }, "bands": { "low": { "label": "", "color": "#B22222" }, "medium": { "label": "", "color": "#ffa500" }, "high": { "label": "", "color": "#008000" } } }, "dimensionAxis": { "showAxis": true, "showTitle": true, "title": "", "customSize": "auto", "icons": { "useIcons": false, "iconProps": { "column": "", "fit": "cover", "type": "round" } } }, "measureAxis1": { "sqrtScale": false, "showAxis": true, "customDomain": { "showDomain": false }, "showTitle": true, "title": "" }, "measureAxis2": { "sqrtScale": false, "showAxis": true, "customDomain": { "showDomain": false }, "showTitle": true, "title": "" }, "legend": { "show": true, "showHeader": true, "inside": false, "descOrder": false, "position": "right-top", "customSize": "auto" }, "tooltip": { "customizeTooltip": false, "showDimensions": true, "dimensions": "", "showMeasures": true, "measures": "", "showPercentage": true, "showNullValues": true, "showBinLabel": true }, "trellis": { "enable": false, "showGridLines": true, "flipLabels": false, "type": "x", "chartsPerLine": 4, "size": [ 100, 100 ] }, "applyConditionalFormatting": true, "showActionMenu": true }, "type": "chart" }, "selectMode": "none", "broadcastFacet": true, "receiveFacetSource": { "mode": "all", "steps": [] } }Subscription Revvenue JSON
{ "type": "chart", "parameters": { "visualizationType": "hbar", "title": { "label": "", "fontSize": 14, "subtitleLabel": "", "subtitleFontSize": 11, "align": "center" }, "theme": "wave", "showValues": true, "axisMode": "multi", "autoFitMode": "keepLabels", "binValues": false, "bins": { "breakpoints": { "low": 0, "high": 100 }, "bands": { "low": { "label": "", "color": "#B22222" }, "medium": { "label": "", "color": "#ffa500" }, "high": { "label": "", "color": "#008000" } } }, "dimensionAxis": { "showAxis": true, "showTitle": true, "title": "", "customSize": "auto", "icons": { "useIcons": false, "iconProps": { "column": "", "fit": "cover", "type": "round" } } }, "measureAxis1": { "sqrtScale": false, "showAxis": true, "customDomain": { "showDomain": false }, "showTitle": false, "title": "", "referenceLines": [ { "color": "#B50E03", "label": { "data": "{{cell(Attrition_Cost_1.result, 0, \"attrCost\").asString()}}", "type": "static" }, "value": { "data": "{{cell(Attrition_Cost_1.result, 0, \"attrCost\").asString()}}", "type": "static" } } ] }, "measureAxis2": { "sqrtScale": false, "showAxis": true, "customDomain": { "showDomain": false }, "showTitle": true, "title": "" }, "legend": { "show": true, "showHeader": true, "inside": false, "descOrder": false, "position": "right-top", "customSize": "auto" }, "tooltip": { "customizeTooltip": false, "showDimensions": true, "dimensions": "", "showMeasures": true, "measures": "", "showPercentage": true, "showNullValues": true, "showBinLabel": true }, "trellis": { "enable": false, "showGridLines": true, "flipLabels": false, "type": "x", "chartsPerLine": 4, "size": [ 100, 100 ] }, "applyConditionalFormatting": true, "showActionMenu": true, "exploreLink": true, "columnMap": { "trellis": [], "plots": [ "sum_Total_Charges" ], "dimensionAxis": [ "Region" ] }, "step": "Subscriber_Revenue_1" } }Subscription Revenue Query
q = load "Beattie_Subs"; q = group q by 'Region'; q = foreach q generate 'Region' as 'Region', sum('Total_Charges') as 'sum_Total_Charges'; q = order q by 'Region' asc; q = limit q 2000;from this:
003 "query": "q = load \"Beattie_Subs\";\r\nq_A = filter q by 'Tenure' >= 0 && 'Tenure' <= 100 && 'Churn' == \"Yes\";\r\nresult = group q_A by all;\r\nresult = foreach result generate count(q_A) as 'A';\r\nresult = foreach result generate 'A', A*950.00 as 'attrCost';\r\nresult = limit result 2000;",
to this (see what I bolded):
"query": "q = load \"Beattie_Subs\";\nq_A = filter q by {{row(Tenure_Length_1.selection,[0],[\"min\",\"max\"]).asRange (\"Tenure\")}} && 'Churn' == \"Yes\";\nresult = group q_A by all;\nresult = foreach result generate count(q_A) as 'A';\nresult = foreach result generate 'A', A*950.00 as 'attrCost';\nresult = limit result 2000;\n",
Then you need to set up the reference line via the chart and BIND the reference line to the Attrition_Cost using the chart (as I have shown in the photos). SAVE your work in your DASHBOARD.
Next, look at your JSON and see if your JSON for your reference line has changed. It should show DYNAMIC not STATIC.
Yours currently look like this:
"referenceLines": [
060 {
061 "color": "#B50E03",
062 "label": {
063 "data": "{{cell(Attrition_Cost_1.result, 0, \"attrCost\").asString()}}",
064 "type": "static"
065 },
066 "value": {
067 "data": "{{cell(Attrition_Cost_1.result, 0, \"attrCost\").asString()}}",
068 "type": "static"
069 }
070 }
071 ]
It should look like this:
"referenceLines": [
{
"color": "#E74340",
"label": {
"data": {
"displayTemplate": "[attrCost]",
"sourceType": "result",
"step": "Attrition_Cost_1"
},
"type": "dynamic"
},
"value": {
"data": {
"field": "attrCost",
"sourceType": "result",
"step": "Attrition_Cost_1"
},
"type": "dynamic"
}
}
],
Hey Marite I did same as you told me but don't know why mine not working
Yes
"columnMap": {
115 "trellis": [],
116 "plots": [
117 "sum_Total_Charges"
118 ],
119 "dimensionAxis": [
120 "Region"
121 ]
When you click on the High Risk (left chart), does your reference line move? And when you click on Medium Risk, Low Risk?
"referenceLines": [ { "color": "#B50E03", "label": { "data": "{{cell(Attrition_Cost_1.result, 0, \"attrCost\").asString()}}", "type": "static" }, "value": { "data": "{{cell(Attrition_Cost_1.result, 0, \"attrCost\").asString()}}", "type": "static" } } ],
Yes Line is move but not percentage and also it not move as per requirement
There seems to be a glitch in trailhead challenge and it forces some people to use the static.
"referenceLines": [
060 {
061 "color": "#B50E03",
062 "label": {
063 "data": "{{cell(Attrition_Cost_1.result, 0, \"attrCost\").asString()}}",
064 "type": "static"
065 },
066 "value": {
067 "data": "{{cell(Attrition_Cost_1.result, 0, \"attrCost\").asString()}}",
068 "type": "static"
069 }
070 }
071 ]
If I use Static content then it shows followinng Error:
Challenge Not yet complete... here's what's wrong:
We can't confirm the Subscriber Revenue chart is filtering by the Tenure Length toggle. Confirm there's a binding that filters attrition costs displayed in the reference line.
Yes Marite
How can I correct it. I mean I have no idea can you please help me out to corrwct my reference line, because as you provide the JSON fot reference Line. I put the same.
oem = load "Beattie_OEM_Survey";
subs = load "Beattie_Subs";
q = cogroup oem by ('Region', 'Account_Manager'), subs by ('Region', 'Account_Manager');
q = foreach q generate oem.'Region' as 'Region', round(avg(oem.'CSAT')) as 'avg_CSAT', round(avg(subs.'Tenure')) as 'avg_Tenure';
q = order q by 'avg_CSAT' asc;
I'm stuck with challenge 5. Can you please help with below error? Thanks
Here are the steps I've done
1. created a story with name "Beattie Subs".
2. created below fields in object "Subscriber"
Tenure Outcome (Number)
Tenure Explanation (Text Area (Long))
Tenure Prescription (Text Area (Long))
3.
After creating the story with any name just click the drop-down arrow button which is exist in right top corner. Click Deploy Model -> In the first screen just give the name 'predicted tenure' as Prediction Title -> next screen select Subscriber object -> Map Fields -> No prediction field -> No segment filter -> Add variable(Tick the variables) -> Reveiw -> Deploy.
4. Create a custom setting
5. Create a trigger in object "Subscriber"
6. create process builder
7. Error before save cancelled subscriber record
Could you taka a look at my post to Mahaq_b on April 10, 2020? Could you please confirm what you see for checklist items 1, 2, 3 and 6?
@Marite Ferrero
As you mentioned above i followed the steps. I cant see the {{row(Tenure_Length_1.selection,[0],[\"min\",\"max\"]).asRange (\"Tenure\")}} in my JSON under Churn_Tenure_1
Kindly help me to find out.
Hi Sudharsan C
The way you deploy your bind is through the JSON. Your snapshot shows the correct JSON code under "Churn_Tenure_1.
Look at your Line 135.
Replace:
'Tenure' >= 0 && 'Tenure' <= 100
with this:
{{row(Tenure_Length_1.selection,[0],[\"min\",\"max\"]).asRange (\"Tenure\")}}
So then it will look like this:
"Churn_Tenure_1": {
"broadcastFacet": true,
"groups": [],
"label": "Churn Tenure",
"numbers": [],
"query": "q = load \"Beattie_Subs\";\nq = filter q by {{row(Tenure_Length_1.selection,[0],[\"min\",\"max\"]).asRange (\"Tenure\")}};\nq_B = filter q by 'Churn' == \"Yes\";\nresult = group q by all full, q_B by all;\nresult = foreach result generate (count(q_B) / count(q))*100 as 'churnRate';",
"receiveFacetSource": {
"mode": "all",
"steps": []
},
It should then work. Please upvote if this answer helps you.
Can you take a snapshot of the error and share? Thanks.
Here is the error message when I click "Save" in any subscriber record.
SetDealPrediction: execution of AfterUpdate caused by: System.UnexpectedException: Salesforce System Error: 962948501-17954 (-651761767) (-651761767) Class.ConnectApi.SmartDataDiscovery.predict: line 404, column 1 Class.ed_insights.PredictionUtil.predict: line 49, column 1 Class.ed_insights.PredictionUtil.predict: line 3, column 1 Class.ed_insights.PredictionIntegration.setPredictionMain: line 26, column 1 Class.ed_insights.PredictionIntegration.setPrediction: line 6, column 1 Class.ed_insights.TriggerHandler.insertUpdateHandle: line 34, column 1 Trigger.SetDealPrediction: line 6, column 1
Thanks
I need the JSON for challenge 2.
I checked your Apex Trigger and your Custom Settings of your Einstein Discovery - Write Back Edit and they both seem to be good.
Can you just share your Custom Settings Definition Detail for your Einstein Discovery Writeback? You can do that by right-clicking into a new tab - on "Einstein Discovery - Write Back" on your "Custom Settings page".
right-clicking on this will show this:
And just so to make it easier to diagnose, can you also ensure that you just have 1 active model (see my snapshot below)?
Here is the screenshot for custom setting
There is only 1 model in this org as it's a newly created dev org with Einstein enabled for this superbadge only
However, I passed the challenge without resolving this error.
/*
This file is generated and isn't the actual source code for this
managed global class.
This read-only file shows the class's global constructors,
methods, variables, and properties.
To enable code to compile, all methods return null.
*/
global class PredictionIntegration {
global PredictionIntegration() {
}
global static void setPrediction(String configName, String entityIdsStr, Boolean isNotTest) {
}
global static void setPredictionWithFieldValues(String configName, String fieldValuesJson, Boolean isNotTest) {
}
global static void setPredictionWithFieldValues(ed_insights__SDDPredictionConfig__c config, List<ConnectApi.SmartDataDiscoveryPredictInputRowObject> rows, List<String> columnNames, List<Id> entityIdsStr, Boolean isNotTest) {
}
global static void setPredictionWithFieldValues(ed_insights__SDDPredictionConfig__c config, List<ConnectApi.SmartDataDiscoveryPredictInputRowObject> rows, Set<String> columnNames, List<Id> entityIdsStr, Boolean isNotTest) {
}
global static void setPrediction(ed_insights__SDDPredictionConfig__c config, List<Id> entityIdsStr, Boolean isNotTest) {
}
global class PredictionIntegrationException extends Exception {
}
}
Here is my json for attrition cost
"query": "q = load \"Beattie_Subs\";\r\nq = filter q by{{row(Tenure_Length_1.selection,[0],[\"min\",\"max\"]).asRange (\"Tenure\")}};\r\nq_B = filter q by 'Churn' == \"Yes\";\r\nresult = group q by all full, q_B by all;\r\nresult = foreach result generate count((q_B))*950 as 'attrCost';\r\n\r\n",
when I update my json for ref line as this I am getting error as my dashboard is not saving my work..
"referenceLines": [
{
"color": "#E84340",
"label": "{{cell(Attrition_Cost_1.result,0,\"attrCost\").asString()}}",
"value": "{{cell(Attrition_Cost_1.result,0,\"attrCost\").asString()}}"
}
],
Can Someone help me.
you don't really need to change the code in your JSON to set up the reference line.
You can set it up with these settings (see below) and that should connect your Attrition_Cost to the Reference Line
OR try this - change your JSON to below (I don't see your JSON as having the "type": "static" for both "label" and "value".
062 "label": {
063 "data": "{{cell(Attrition_Cost_1.result, 0, \"attrCost\").asString()}}",
064 "type": "static"
065 },
066 "value": {
067 "data": "{{cell(Attrition_Cost_1.result, 0, \"attrCost\").asString()}}",
068 "type": "static"
I'm getting this error when trying to create the attrition step? What am I doing wrong? I cant seem to figure out how to do the second part in the 3rd step
Change the quotes enclosing "Yes" to straight quotes. If you look closely, those quotes you have enclosing YES are a bit curly quotes.
It created another chart. That wasn't the goal, right? Wasn't it supposed to do something with my original chart?
You're on the right track. Revise the Title of "Sum of Total Charges" Chart to "Subscription Revenue"
Then it says, create another step - Attrition Cost (It didn't say create a chart) - which you did as I see your SaQL.
Next, you need to go to your JSON to implement the binding.
Look for the code that shows this query related to churnRate
Replace:
'Tenure' >= 0 && 'Tenure' <= 100
with this:
{{row(Tenure_Length_1.selection,[0],[\"min\",\"max\"]).asRange (\"Tenure\")}}
So then it will look like this:
"Churn_Tenure_1": {
"broadcastFacet": true,
"groups": [],
"label": "Churn Tenure",
"numbers": [],
"query": "q = load \"Beattie_Subs\";\nq = filter q by {{row(Tenure_Length_1.selection,[0],[\"min\",\"max\"]).asRange (\"Tenure\")}};\nq_B = filter q by 'Churn' == \"Yes\";\nresult = group q by all full, q_B by all;\nresult = foreach result generate (count(q_B) / count(q))*100 as 'churnRate';",
"receiveFacetSource": {
"mode": "all",
"steps": []
},
----
To create a results binding that displays attrition cost in the reference line and to make it possible for the reference line value to filter by length of tenure from the Tenure Length toggle:
1. Look in your JSON for your code that produces attrcost so you can set the binding here as well. This is done by changing your filter by to this: {{row(Tenure_Length_1.selection,[0],[\"min\",\"max\"]).asRange (\"Tenure\")}}
Notice that this is similar to the bind for churnRate.
----
Then to add a reference line - go click on teh Subscription Revenue Chart, on the right side where you can configure the chart settings, you will see that you can add a reference line.
If you click on the "Subscription Revenue" vertical bar chart; you will see that you can add a reference line.
You can then link the reference line's value and label to the attribution cost (see my post dated April 28 2020 to Sumanth Reddy.
Try this. Let me know if it works.
I pressed Ctrl-E to input the correct code into my JSON. All good there, I believe.
My Query for Attrition:
q = load "Beattie_Subs1";
q = group q by 'Region';
q = foreach q generate 'Region' as 'Region', sum('Total_Charges') as 'sum_Total_Charges';
q = order q by 'Region' asc;
q = limit q 2000;
-----------------
When I went to implement a value it was asking for a numeric value (somehow it accepted the manual entry I mimic'd from April 28th).
What am I missing here (see pictures)? Beyond grateful and appreciate for your feedback and help :)
JSON (I believe for the area we are working on):
"Attrition_Cost_1": {
"broadcastFacet": true,
"groups": [],
"label": "Attrition Cost",
"numbers": [],
"query": "q = load \"Beattie_Subs1\";\r\nq = filter {{row(Tenure_Length_1.selection,[0],[\"min\",\"max\"]).asRange (\"Tenure\")}};\r\nresult = filter q by 'Churn' == \"Yes\";\r\nresult = group result by all;\r\nresult = foreach result generate count() as 'count', count()*950 as attrCost;\r\nresult = limit result 2000;",
"receiveFacetSource": {
"mode": "all",
"steps": []
},
"selectMode": "single",
"strings": [],
"type": "saql",
"useGlobal": true,
"visualizationParameters": {
"parameters": {
"autoFitMode": "keepLabels",
"showValues": true,
"bins": {
"breakpoints": {
"high": 100,
"low": 0
},
"bands": {
"high": {
"color": "#008000",
"label": ""
},
"low": {
"color": "#B22222",
"label": ""
},
"medium": {
"color": "#ffa500",
"label": ""
}
}
},
"legend": {
"descOrder": false,
"showHeader": true,
"show": true,
"customSize": "auto",
"position": "right-top",
"inside": false
},
"axisMode": "multi",
"tooltip": {
"showBinLabel": true,
"measures": "",
"showNullValues": true,
"showPercentage": true,
"showDimensions": true,
"showMeasures": true,
"customizeTooltip": false,
"dimensions": ""
},
"visualizationType": "hbar",
"title": {
"fontSize": 14,
"subtitleFontSize": 11,
"label": "",
"align": "center",
"subtitleLabel": ""
},
"binValues": false,
"trellis": {
"flipLabels": false,
"showGridLines": true,
"size": [
100,
100
],
"enable": false,
"type": "x",
"chartsPerLine": 4
},
"showActionMenu": true,
"measureAxis2": {
"sqrtScale": false,
"showTitle": true,
"showAxis": true,
"title": "",
"customDomain": {
"showDomain": false
}
},
"measureAxis1": {
"sqrtScale": false,
"showTitle": true,
"showAxis": true,
"title": "",
"customDomain": {
"showDomain": false
}
},
"theme": "wave",
"dimensionAxis": {
"showTitle": true,
"customSize": "auto",
"showAxis": true,
"title": "",
"icons": {
"useIcons": false,
"iconProps": {
"fit": "cover",
"column": "",
"type": "round"
}
}
},
"applyConditionalFormatting": true
},
"type": "chart"
}
Hopefully the dump of information helps provide direction.
062 "label": {
063 "data": "{{cell(Attrition_Cost_1.result, 0, \"attrCost\").asString()}}",
064 "type": "static"
065 },
066 "value": {
067 "data": "{{cell(Attrition_Cost_1.result, 0, \"attrCost\").asString()}}",
068 "type": "static"
Saved and good to go, but unable to pass. Aslo, my X-Axis looks like this :
It says that it cannot find your Subscriber Revenue chart /query.
1. You said: "When I went to implement a value it was asking for a numeric value (somehow it accepted the manual entry I mimic'd from April 28th". Remove this.
2. The Subscriber Revenue chart and the red reference line depend on the Churn_Tenure_1 chart as well as the pillbox (High Risk/ Medium Risk / Low Risk) on top of it.
Can you check your JSON for Churn_Tenure_1 and confirm that you also have set up the binding there? Like this below:
3. Go back to your dashboard and click on any block that does not have a chart/element. Look at the right side showing the list of queries and static.
Check that you have the following queries:
- Attrition Cost (no chart required)
- Churn Tenure (left chart)
- Subscriber Revenue (right horizontal bar chart)
4. Check that you have static: Tenure LengthIf you look at the snapshot below, you will see all these on the right side.
5. Click on the 'properties' of Tenure Length; then click on Advanced Editor. Is your JSON for Tenure Length like this:
{
"broadcastFacet": true,
"columns": {
"Display": {
"type": "string"
}
},
"label": "Tenure Length",
"selectMode": "single",
"start": {
"display": []
},
"type": "staticflex",
"values": [
{
"display": "High Risk",
"value": "1 to 12 months",
"min": 1,
"max": 12
},
{
"display": "Medium Risk",
"value": "13 to 24 months",
"min": 13,
"max": 24
},
{
"display": "Low Risk",
"value": "25 to 36 months",
"min": 25,
"max": 36
}
],
"numbers": [],
"strings": [],
"groups": []
}
6. click on your Subscriber Revenue chart. Make sure you apply 'red' as the colour for your reference line.
let me know if it work.
Anyway, your explanations were extremely helpful as I carefully went back through everything.
I believe where I'm stuck now is that I'm creating an incorrect Attrition Query. What is the query for that? I believe once I have this I'll be able to link them.
I have the Query Attrition_Cost, however, when I goto reference them I can select my Attrition_Cost as a Interaction Source, but my Reference Line Value is "Sum of Total Charges."
I found this by clicking my Subscription Revenue Chart > X-Axis (Top) > + Reference Line then clicking the blue box/arrow guy. See Pictures below for reference.
You should also have your binding here (like this - see snapshot):
You change the filter so that it also uses this: {{row(Tenure_Length_1.selection,[0],[\"min\",\"max\"]).asRange (\"Tenure\")}}
Then click on Subscriber Chart and see if you can link your reference line to the attrition cost like I have previously showed
q = load "Beattie_Subs";
q = filter q by 'Tenure' in all;
result = filter q by 'Churn' == "Yes";
result = group result by all;
result = foreach result generate count() as 'count', count()*950 as attrCost;
result = limit result 2000;
added this to my query. And now have the correct line. Went to try and complete the challenge and got this error:
Do I need to change something from dynamic to static? What do you think?
then conform you level and value to this:
let me know if this works.
Challenge 3 Completed. YOU.ARE.AWESOME. Litterally went to sleep and woke up thinking about this challenge. Much love and appreciation.
Moving onto Challenge 4!
I have created the custom field for subscriber object
Installed the Managed Packaged
Created the Custom setting
Created the trigger
Created the Process Builder.
did you set up the prediction id correctly?
https://help.salesforce.com/articleView?id=bi_edd_model_manager_view.htm&type=5
Hi All.
I´m kind of struggling on chellenge 2 since two days. I have already gone through the entire thread but couldnt find the right answer for my problem.
I think my toggle for the widget is wrong.
Thats how I did it:
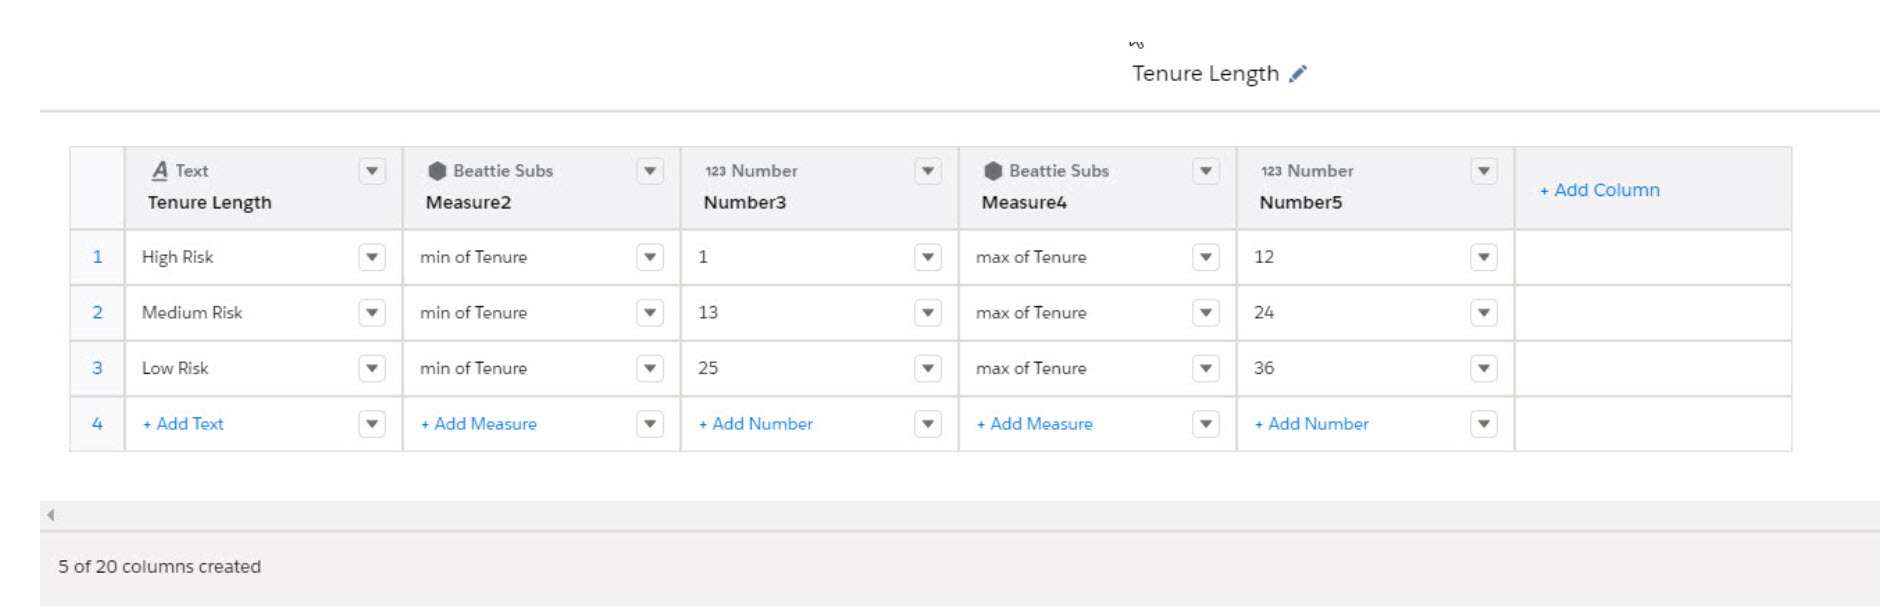
1: I clicked on Create Query
2: Create Custom Query
3:thats how my toggle looks like:
Can some help on this? Really appreaciate your help!
Best,
Ben
your Tenure_Length should be set up this way:
Click on Tenure_Length_1 down arrow and click on properties; then click on advanced editor to see the JSON (query) and you should see this:
{
"broadcastFacet": true,
"columns": {
"Display": {
"type": "string"
}
},
"label": "Tenure Length",
"selectMode": "single",
"start": {
"display": []
},
"type": "staticflex",
"values": [
{
"display": "High Risk",
"value": "1 to 12 months",
"min": 1,
"max": 12
},
{
"display": "Medium Risk",
"value": "13 to 24 months",
"min": 13,
"max": 24
},
{
"display": "Low Risk",
"value": "25 to 36 months",
"min": 25,
"max": 36
}
],
"numbers": [],
"strings": [],
"groups": []
}
Thanks for your anwer. I completed my superbadge. The writeback package was installed correctly. The problem was with the name that I was giving to the story. I was givingan incorrect name to the model whihc was required to be deployed.
Hi @Marite Ferrero 36,
Thank you for your answer. I still don´t have the right Toggle.
Thats how my create custom query looks like in default:
I think theres something wrong with it...
1. you actually do not need to define the value column (1 to 12 months, etc.). All you need are the min and max columns.
2. for the 'min' column, select '123 number' and label it as 'min'.
3. do the same for the max column.
Then when you are done defining the Tenure Length static, go to your Churn Tenure chart and click on the 'advanced editor'; then select 'query'.
here, you will have to bind your toggle selection (Tenure Length) to your Churn Tenure chart,
You bind it by changing this:
"query": "q = load \"Beattie_Subs\";\nq = filter q by 'Tenure' >= 0 && 'Tenure' <= 100;\nq_B = filter q by 'Churn' == \"Yes\";\nresult = group q by all full, q_B by all;\nresult = foreach result generate (count(q_B) / count(q))*100 as 'churnRate';\n",
to this:
"query": "q = load \"Beattie_Subs\";\nq = filter q by {{row(Tenure_Length_1.selection,[0],[\"min\",\"max\"]).asRange (\"Tenure\")}};\nq_B = filter q by 'Churn' == \"Yes\";\nresult = group q by all full, q_B by all;\nresult = foreach result generate (count(q_B) / count(q))*100 as 'churnRate';\n",
Let me know if you got it.
When i add this query to Chrun Tenure query and click on run query. It keeps on running
q_B = filter q by 'Churn' == "Yes";
result = group q by all full, q_B by all;
Can anyone help me here
Of course it will keep on running. This query is looking for variables (min and Max) passed on by this: " {{row(Tenure_Length_1.selection,[0],[\"min\",\"max\"]).asRange (\"Tenure\")}} "
You first need to write your query as such - and then run it.
q = load "Beattie_Subs";

q = filter q by 'Tenure' >= 0 && 'Tenure' <= 100;
q_B = filter q by 'Churn' == "Yes";
result = group q by all full, q_B by all;
result = foreach result generate (count(q_B) / count(q))*100 as 'churnRate';
then after you define your Tenure Length (toggle), you then go back to above query's JSON and update the filter with:
{{row(Tenure_Length_1.selection,[0],[\"min\",\"max\"]).asRange (\"Tenure\")}}
see my post to Ben on May 6, 2020.
Please click thumbs up if this works for you.
Yes i saw that post and this fixed my issue and completed this step
Any Help
2. Then push the Subscriber Revenue Query onto the dashboard as a horizontal bar chart.
3. Then you need to create another Query called Attrition Cost
q = load "Beattie_Subs";
q = filter q by 'Tenure' >= 0 && 'Tenure' <= 100;
result = filter q by 'Churn' == "Yes";
result = group result by all;
result = foreach result generate count() as 'count', count()*950 as attrCost;
result = limit result 2000;
4. click on your Subscriber Revenue Chart, while you're under "WIDGET", go down till you see X-Axis (Top). Here you will add the Reference Line. like this below. When you add the reference line label, make sure to select 'attrcost' so that the numbers show up in the reference line.
5. then click on an empty spot in your dashboard. go to to Attribution Cost on the right hand bar. Click on the down arrow of Attribution Cost, click on Properties. Then click on advanced editor. To bind your toggle to the Attribution Cost, you will need to revise the JSON that you see for your Attribution Cost. Change the filter by to (see what's bolded below):
"query": "q = load \"Beattie_Subs1\";\r\nq = filter by {{row(Tenure_Length_1.selection,[0],[\"min\",\"max\"]).asRange (\"Tenure\")}};\r\nresult = filter q by 'Churn' == \"Yes\";\r\nresult = group result by all;\r\nresult = foreach result generate count() as 'count', count()*950 as attrCost;\r\nresult = limit result 2000;",
Click on thumbs up please if this works for you. It should work.
@Marite Ferrero
Thank you for your effort! I highly appreciate it! I did all the things you told me and it worked!
Sorry Attrition not Attribution (was working on something else)... Just be aware to use the right labels/names.
Thanks a lot, it resolved my issue. Issue was that i was trying to update JSON after adding reference line to the Chart. It was not working. Finally resolved it, thanks a lot for your inputs
1. Create a Query which will require Multiple Datasets. Name this query: Beattie Survey
when creating this query, you would use a cogroup:
subs = load "Beattie_Subs";
q = cogroup oem by ('Region', 'Account_Manager'), subs by ('Region', 'Account_Manager');
[you can do the rest of the query from here...]
3. The right side chart is a lot easier. It uses only the Beattie OEM Survey. You create your query for this.
4. on the chart mode, you use a Treemap.
5. push "Beattie Survey" into the dashboard (left side chart)
6. push "Beattie OEM Survey" into the dashboard (right side chart)
7. make the 2 charts (left side and right side charts interact). You do this with faceting. Click on "Beattie Survey" chart. then click on "Query" right next to "Widget". Here you can set your faceting. I'll let you do faceting..
8. do the same thing for the right side chart. Click on right side chart. then click on "Query" right next to "Widget". Here you can set your faceting. I'll let you do faceting.. (NOTE that requirements say to allow user to select 1 to many bars of the left side chart and that it should reflect on the right side chart)
Marite Ferrero
Cna you help me with steps for Challange 5
Check out my post to Mahak on April 10, 2020. It shows a checklist. let me know if that helps.
What i am not able to understand is the sequence of activities, this is what i did till now:
1. I created 3 fields on subscriber object i.e. Tenure Outcome, Tenure Explanation, Tenure Prescription
2. I installed the managed package (it took me lot of time but finally was able to do it)
3. I created a story named Predicted Tenure on Beattie Subs dataset
4. In analytics studio, i went to Model Manager and i am not able to find active model
Is this the write way or i messed up the steps
I am yet to create a tenure custom setting
I completed my Superbadge, this is really cool place to test your skills.
Thanks everyone who contributed
Thanks
JSON:
"Attrition_Cost_1": {
"broadcastFacet": true,
"groups": [],
"label": "Attrition Cost",
"numbers": [],
"query": "q = load \"Beattie_Subs\";\nq_A = filter q by {{row(Tenure_Length_1.selection,[0],[\"min\",\"max\"]).asRange (\"Tenure\")}} && 'Churn' == \"Yes\";\nresult = group q_A by all;\nresult = foreach result generate count(q_A) as 'A';\nresult = foreach result generate 'A', A*950.00 as 'attrCost';\nresult = limit result 2000;\n",
"receiveFacetSource": {
"mode": "all",
"steps": []
},
"selectMode": "single",
"strings": [],
"type": "saql",
"useGlobal": true,
"visualizationParameters": {
"parameters": {
"autoFitMode": "keepLabels",
"showValues": true,
"bins": {
"breakpoints": {
"high": 100,
"low": 0
},
"bands": {
"high": {
"color": "#008000",
"label": ""
},
"low": {
"color": "#B22222",
"label": ""
},
"medium": {
"color": "#ffa500",
"label": ""
}
}
},
"referenceLines": [
{
"color": "#E74340",
"label": {
"data": {
"displayTemplate": "[attrCost]",
"sourceType": "result",
"step": "Attrition_Cost_1"
},
"type": "dynamic"
},
"value": {
"data": {
"field": "attrCost",
"sourceType": "result",
"step": "Attrition_Cost_1"
},
"type": "dynamic"
}
}
],
1. Can you try relaunching your trailhead playground and then check the challenge step to see if you'd still get an error?
2. If yes (if you still see an error), can you go to your dashboard, double-click on your Subscription Revenue Chart and then click/select "Query Mode" and copy and paste your query for Subscriber Revenue?
3. go back to your dashboard, click on any empty spot. then click once on your subscription revenue chart. On the right side, you will see the settings panel. Click on "Query". Is 'Apply Global Filters' checked? What did you select for "Faceting"? What did you select for "Selection Type"? Is 'Broadcast selections as facets' checked?
4. can you click on 'WIDGET' which is on the left-side of "QUERY" and take a snapshot of your X-Axis (Top) and share the snapshot here?
Receiving the below error while completing challenge #3 of the supernadge
There was an unhandled exception. Please reference ID: VTREZLDW. Error: Restforce::ResponseError. Message: 550: Cannot convert dynamic parameters of a reference line in chart widgets
Code for Subscriber Revenue Widget:
"referenceLines": [
{
"color": "#B50E03",
"label": {
"type": "dynamic",
"data": {
"step": "Attrition_Cost_1",
"sourceType": "result",
"displayTemplate": "[attrCost]"
}
},
"value": {
"type": "dynamic",
"data": {
"step": "Attrition_Cost_1",
"field": "attrCost",
"sourceType": "result"
}
}
Attrition Cost Query:
"query": "q = load \"Beattie_Subs\";\nq = filter q by 'Churn' == \"Yes\" && {{row(Tenure_Length_1.selection,[0],[\"min\",\"max\"]).asRange(\"Tenure\")}};\nq = group q by all;\nq = foreach q generate count()*950 as 'attrCost';\nq = limit q 2000;",
Please suggest me steps to get rid of the error.
1. Can you click on your Subscriber Revenue chart, then under WIDGET (on the right side panel) - look at your X-Axis (TOP) and see if it looks like this?
2. Click on 'Attrition_Cost_1' under value; and confirm that your Interaction Source shows 'Attrition_Cost_1' and that your reference value shows 'attrCost' and you have 'result' checked as your Interaction Type?
3. Click on 'Attrition_Cost_1' under label; and confirm that your Interaction Source shows 'Attrition_Cost_1' and that your reference value shows 'attrCost' and you have 'result' checked as your Interaction Type?
4. save your changes and check the challenge again.
5. If you are still getting the same error, then change your label and value in your JSON to this:
"label": {
"data": "{{cell(Attrition_Cost_1.result, 0, \"attrCost\").asString()}}",
"type": "static"
},
"value": {
"data": "{{cell(Attrition_Cost_1.result, 0, \"attrCost\").asString()}}",
"type": "static"
}
6. Let me know what worked for you.
After applying the above steps and Now the error message has changed to We can't find the Subscriber Revenue step. Check step name and spelling.
Please suggest solution.
Regards,
Shubham shah
1. click on your Subscription Revenue chart.
2. click on "WIDGET" on the righthand panel. Make sure your chart TITLE is "Subscription Revenue"
3. click on "QUERY" which on the right side of "WIDGET". Your query id should be Subscriber_Revenue_1 and your Display label should be Subscriber Revenue
Let me know if this works.
Beattie Survey : SAQL :
oem = load "Beattie_OEM_Survey";
subs = load "Beattie_Subs";
q = cogroup oem by ('Region', 'Account_Manager'), subs by ('Region', 'Account_Manager');
q = foreach q generate oem.'Region' as 'Region', round(avg(oem.'CSAT')) as 'avg_CSAT', round(avg(subs.'Tenure')) as 'avg_Tenure';
q = order q by 'avg_CSAT' asc;
OEM : SAQL:
q = load "Beattie_OEM_Survey";
q = group q by 'OEM';
q = foreach q generate 'OEM' as 'OEM', count() as 'count';
q = order q by 'OEM' asc;
q = limit q 2000;
Pleaes help how to proceed. !
It's complaining that you have not set the chart marker as per requirements.
7. Add a chart marker to the Beattie Survey chart for the first state with the lowest average CSAT score. It will be a hard-coded marker to help validation assess your solution.
You do this by:
a. clicking on the left side chart. then go to the right-side panel under "WIDGET". Go down till you see "CHART MARKERS".
b. Click on "EDIT CHART MARKERS"
c. Then go back to your left side chart and click on the first vertical bar under "Avg of CSAT" (That would be Illinois)
d. then you can set your chart marker like this
Let me know if this works for you.
It did work. Great help.
Thank you
It did work. Great help.
Thank you
Attrition_Cost_1
"query": "q = load \"Beattie_Subs\";\r\nq= filter q by {{row(Tenure_Length_1.selection,[0],[\"min\",\"max\"]).asRange (\"Tenure\")}};\r\nq_B = filter q by 'Churn' == \"Yes\";\r\nresult = group q by all full, q_B by all;\r\nresult = foreach result generate count((q_B))*950 as 'attrCost';\r\nresult = limit result 2000;",
Reference Lines tried with multiple approaches -
Approach 1:
"referenceLines": [
{
"color": "#E74340",
"label": "{{cell(Attrition_Cost_1.result,0,\"attrCost\").asString()}}",
"value": "{{cell(Attrition_Cost_1.result,0,\"attrCost\").asString()}}"
}
],
I get the Validation for Reference lines error
Approach 2:
"referenceLines": [
{
"color": "#B50E03",
"label": {
"data": "{{cell(Attrition_Cost_1.result, 0, \"attrCost\").asString()}}",
"type": "static"
},
"value": {
"data": "{{cell(Attrition_Cost_1.result, 0, \"attrCost\").asString()}}",
"type": "static"
}
}
],
I get the following while checking challenge
Challenge Not yet complete... here's what's wrong:
We can't confirm the chart reference lines have the correct label and value. The reference line has to have attrition costs as its label and value, plus filter by the Tenure Length toggle.
Approach 3:
Setting it from Widget - X-Axis (top) - Adding the Reference lines
Still the challange does not get complete. Please advice.
Did you look at my May 7, 2020 post? It's a post between Benedikt's and Rohit's posts?
It starts with this:
2. Then push the Subscriber Revenue Query onto the dashboard as a horizontal bar chart.
3. Then you need to create another Query called Attrition Cost
When you tried approach 3, what exactly is the challenge error message?
I Created a Subscriber Revenue Query
1. Subscriber_Revenue_1
q = group q by 'Region';
q = foreach q generate 'Region' as 'Region', sum('Total_Charges') as 'sum_Total_Charges';
q = order q by 'Region' asc;
q = limit q 2000;
3. Then created a new query - Attrition_Cost_1
q = filter q by 'Tenure' >= 0 && 'Tenure' <= 100;
result = filter q by 'Churn' == "Yes";
result = group result by all;
result = foreach result generate count() as 'count', count()*950 as attrCost;
result = limit result 2000;
5. Now, I’m able to save it and preview it.
6. Now I start with the binding
"query": "q = load \"Beattie_Subs\";\r\nq= filter q by {{row(Tenure_Length_1.selection,[0],[\"min\",\"max\"]).asRange (\"Tenure\")}};\r\nresult = filter q by 'Churn' == \"Yes\";\r\nresult = group result by all;\r\nresult = foreach result generate count() as 'count', count()*950 as attrCost;\r\nresult = limit result 2000;",
7. Now when I preview, I see that the binding is working.
8. Finally, I check the challenge and following error
There was an unhandled exception. Please reference ID: BGVQOCTW. Error: Restforce::ResponseError. Message: 550: Cannot convert dynamic parameters of a reference line in chart widgets
9. When I check the Reference Lines, I see the following
{
"value": {
"type": "dynamic",
"data": {
"step": "Attrition_Cost_1",
"field": "attrCost",
"sourceType": "result"
}
},
"label": {
"type": "dynamic",
"data": {
"step": "Attrition_Cost_1",
"sourceType": "result",
"displayTemplate": "[attrCost]"
}
},
"color": "#E74340"
}
]
},
Can you please help?
Thanks,
Amit
Can you check how you have set up your reference value and label interaction?
1. Can you click on your Subscriber Revenue chart, then under WIDGET (on the right side panel) - look at your X-Axis (TOP) and see if it looks like this?
2. Click on 'Attrition_Cost_1' under value; and confirm that your Interaction Source shows 'Attrition_Cost_1' and that your reference value shows 'attrCost' and you have 'result' checked as your Interaction Type?
3. Click on 'Attrition_Cost_1' under label; and confirm that your Interaction Source shows 'Attrition_Cost_1' and that your reference value shows 'attrCost' and you have 'result' checked as your Interaction Type?
4. save your changes and check the challenge again.
5. If you are still getting the same error (550), then change your label and value in your JSON to this:
"label": {
"data": "{{cell(Attrition_Cost_1.result, 0, \"attrCost\").asString()}}",
"type": "static"
},
"value": {
"data": "{{cell(Attrition_Cost_1.result, 0, \"attrCost\").asString()}}",
"type": "static"
}
6. Let me know what worked for you. Steps 1-4 is the ideal but if it does not work and if it is step 5 that works - then it could be a Salesforce glitch.
But steps 1-5 or Step 6 should work.
After 1 to 4 above, I changed the reference line as follows. Dashboard wors fine but when I check challange, again the new error.
"referenceLines": [
{
"value": {
"type": "static",
"data": "{{cell(Attrition_Cost_1.result, 0, \"attrCost\").asString()}}"
},
"label": {
"type": "static",
"data": "{{cell(Attrition_Cost_1.result, 0, \"attrCost\").asString()}}"
},
"color": "#E74340"
}
]
Challenge Not yet complete... here's what's wrong:
We can't confirm the chart reference lines have the correct label and value. The reference line has to have attrition costs as its label and value, plus filter by the Tenure Length toggle.
Can you check what settings you have against this?
You either do steps 1 to 4 (then check challenge). Or, if that does not work, then do step 5 (then check challenge).
Let me know what challenge result you get when you do Steps 1-4.
Let me know if steps 1-4 did not work. Try Step 5 and then check challenge. Let me know the challenge result.
Also always remember to save your changes; then try your dashboard first using the Preview to make sure it works before checking the challenge.
After step 1 to 4, Saved and previewed the dashboard, It was working and bindings happened but when I check the challange, I get the following error -
There was an unhandled exception. Please reference ID: XCBLEUBX. Error: Restforce::ResponseError. Message: 550: Cannot convert dynamic parameters of a reference line in chart widgets
Now, I make the change to reference list as step-5, again, I save the dashboard and preview, It works well in preview.
When I check the challange, it gives the following error.
Challenge Not yet complete... here's what's wrong:
We can't confirm the chart reference lines have the correct label and value. The reference line has to have attrition costs as its label and value, plus filter by the Tenure Length toggle.
All the names are as per the screenshot that you suggested.
Still no luck to clear the challange.
Thanks,
Amit
Can you take a snapshot of your dashboard with the right hand panel showing all the queries and static you have defined?
Also can you share the entire JSON for your Subscriber Revenue WIDGET? Thanks.
Please find the screenshot of Dashboard and Queries.
Subscription Revenue JSON -
{ "parameters": { "autoFitMode": "keepLabels", "showValues": true, "bins": { "breakpoints": { "high": 100, "low": 0 }, "bands": { "high": { "color": "#008000", "label": "" }, "low": { "color": "#B22222", "label": "" }, "medium": { "color": "#ffa500", "label": "" } } }, "legend": { "descOrder": false, "showHeader": true, "show": false, "customSize": "auto", "position": "right-top", "inside": false }, "axisMode": "multi", "tooltip": { "showBinLabel": true, "measures": "", "showNullValues": true, "showPercentage": true, "showDimensions": true, "showMeasures": true, "customizeTooltip": false, "dimensions": "" }, "visualizationType": "hbar", "exploreLink": true, "title": { "fontSize": 14, "subtitleFontSize": 11, "label": "Subscription Revenue", "align": "center", "subtitleLabel": "" }, "binValues": false, "trellis": { "flipLabels": false, "showGridLines": true, "size": [ 100, 100 ], "enable": false, "type": "x", "chartsPerLine": 4 }, "columnMap": { "trellis": [], "dimensionAxis": [ "Region" ], "plots": [ "sum_Total_Charges" ] }, "showActionMenu": true, "measureAxis2": { "sqrtScale": false, "showTitle": true, "showAxis": true, "title": "", "customDomain": { "showDomain": false } }, "measureAxis1": { "sqrtScale": false, "showTitle": false, "showAxis": true, "referenceLines": [ { "color": "#E74340", "label": { "data": "{{cell(Attrition_Cost_1.result, 0, \"attrCost\").asString()}}", "type": "static" }, "value": { "data": "{{cell(Attrition_Cost_1.result, 0, \"attrCost\").asString()}}", "type": "static" } } ], "title": "", "customDomain": { "showDomain": false } }, "theme": "wave", "step": "Subscriber_Revenue_1", "dimensionAxis": { "showTitle": true, "customSize": "auto", "showAxis": true, "title": "", "icons": { "useIcons": false, "iconProps": { "fit": "cover", "column": "", "type": "round" } } }, "applyConditionalFormatting": true }, "type": "chart" }Thanks,
Amit
Can you try this?
1. Remove lines 65 - 73; save it; preview that it works; then check the challenge?
065 "columnMap": {
066 "trellis": [],
067 "dimensionAxis": [
068 "Region"
069 ],
070 "plots": [
071 "sum_Total_Charges"
072 ]
073 },
I don't have columnMap in mine. I have 2 versions of the chart with reference line (dynamic and static) and both versions do not have this columnMap. I also have read that columnMap can cause bind problems.
Let me know if this solves your problem.
I made the change, saved and previewed. In preview it works but when I check challange the error is as follows
Challenge Not yet complete... here's what's wrong:
We can't confirm the chart reference lines have the correct label and value. The reference line has to have attrition costs as its label and value, plus filter by the Tenure Length toggle.
Below is the JSON after removing columnMap.
{ "parameters": { "autoFitMode": "keepLabels", "showValues": true, "bins": { "breakpoints": { "high": 100, "low": 0 }, "bands": { "high": { "color": "#008000", "label": "" }, "low": { "color": "#B22222", "label": "" }, "medium": { "color": "#ffa500", "label": "" } } }, "legend": { "descOrder": false, "showHeader": true, "show": false, "customSize": "auto", "position": "right-top", "inside": false }, "axisMode": "multi", "tooltip": { "showBinLabel": true, "measures": "", "showNullValues": true, "showPercentage": true, "showDimensions": true, "showMeasures": true, "customizeTooltip": false, "dimensions": "" }, "visualizationType": "hbar", "exploreLink": true, "title": { "fontSize": 14, "subtitleFontSize": 11, "label": "Subscription Revenue", "align": "center", "subtitleLabel": "" }, "binValues": false, "trellis": { "flipLabels": false, "showGridLines": true, "size": [ 100, 100 ], "enable": false, "type": "x", "chartsPerLine": 4 }, "showActionMenu": true, "measureAxis2": { "sqrtScale": false, "showTitle": true, "showAxis": true, "title": "", "customDomain": { "showDomain": false } }, "measureAxis1": { "sqrtScale": false, "showTitle": false, "showAxis": true, "referenceLines": [ { "color": "#E74340", "label": { "data": "{{cell(Attrition_Cost_1.result, 0, \"attrCost\").asString()}}", "type": "static" }, "value": { "data": "{{cell(Attrition_Cost_1.result, 0, \"attrCost\").asString()}}", "type": "static" } } ], "title": "", "customDomain": { "showDomain": false } }, "theme": "wave", "step": "Subscriber_Revenue_1", "dimensionAxis": { "showTitle": true, "customSize": "auto", "showAxis": true, "title": "", "icons": { "useIcons": false, "iconProps": { "fit": "cover", "column": "", "type": "round" } } }, "applyConditionalFormatting": true }, "type": "chart" }While trying to save the subscriber record after having deployed the trigger SetDealPrediction and process builder, the update operation is getting error out as
setDealPrediction: execution of AfterUpdate caused by: System.UnexpectedException: Salesforce System Error: 1744431917-29361 (-70898661) (-70898661) Class.ConnectApi.SmartDataDiscovery.predict: line 404, column 1 Class.ed_insights.PredictionUtil.predict: line 49, column 1 Class.ed_insights.PredictionUtil.predict: line 3, column 1 Class.ed_insights.PredictionIntegration.setPredictionMain: line 26, column 1 Class.ed_insights.PredictionIntegration.setPrediction: line 6, column 1 Class.ed_insights.TriggerHandler.insertUpdateHandle: line 34, column 1 Trigger.SetDealPrediction: line 6, column 1 .
Do you know what i am doing wrong here.
Regards,
Shubham Shah
I also encountered this error if I recall. Did you read my post on April 10, 2020 to Mahak in which I posted a checklist of things to check?
On my part, what I did wrong is that I set up my writeback incorrectly, I typed: Subscriber as my object. The correct entry should be Subscriber__c.
I was then able to edit Cancelled Subscribers and the Predicted Tenure, explanation, etc. were automatically put into the Cancelled Subscriber's Tenure fields. Did you run through that checklist I posted on April 10?
Aimee encountered the same error you encountered but she passed the challenge anyway even with the error.
i am getting the error message as Challenge Not yet complete... here's what's wrong:
We can't confirm the recommendation was published to the Subscriber object. Confirm you completed this step and selected the correct Salesforce custom object.
Although the object value in the Einstein write back custom setting records is already Subscriber__c.
Thanks,
Shubham shah
1. The trickiest part of this exercise is the Prediction ID. Are you sure you set it up correctly?
Is your writeback's Tenure / Prediction Definition ID showing the same ID as shown when you look at the URL of your Prediction Name?
https://help.salesforce.com/articleView?id=bi_edd_model_manager_view.htm&type=5
2. Did you use a clean dev / trailhead playground for this superbadge? Or is it merged with another dev or trailhead playground? If it is merged, then that could be a problem.
To implement Einstein analytics used new org as given in the links from the trailhead and if this is due to merging issue then how will i solve it.
i see no issue over my predication model id as it is 1OR2x000000XaCNGA0 from the url https://ap17.lightning.force.com/wave/wave.app?tsid=02u2x000000mm5z#goal/1OR2x000000XaCNGA0 and pasted the same in the custom setting record in einstein write back.
Here is the record detail of the custom setting records as well.
Name Record ID Object Outcome Field Name Prediction Definition Id Prescription Field Name Created Date
Tenure a032x000004c5L0 Subscriber__c Tenure_Outcome__c 1OR2x000000XaCNGA0 Tenure_Prescription__c 5/14/2020
Thanks,
Shubham Shah
I was helping Amit when I noticed that he his dev was a 'merged' dev playground. I advised him to create a new dev and that cleared up his problem.
You can try the same IF you are using a 'merged' dev. You do not need to redo the previous challenges. You can create a new dev (make sure that you do not merge it with another dev or trailhead playground) and just start with the current challenge that isn't passing.
Challenge Not yet complete... here's what's wrong:
We can't confirm the binding syntax for the Churn Tenure chart. Check that toggle widget selections are updating the Churn Tenure chart. Confirm the binding is using the correct step.
But I'm not able to found where create the step...
Please, someone are able to help me?
You still need to do this (per requirements):
4. Add a toggle widget above the Churn Tenure chart.
5. Add Tenure Length as the display label.
6. Add the following custom definition to the widget.
High Risk 1 to 12 months
Medium Risk 13 to 24 months
Low Risk 25 to 36 months
You can take a look at this: https://help.salesforce.com/articleView?id=bi_dashboard_steps_custom_flex.htm&type=5
It will guide you on what to do. You can then compare your work to what's already been posted in this message thread (i.e. Tenure Length and binding)
q = load "Beattie_Subs";
q = filter q by {{row(Tenure_Length.selection, [0], [\"min\",\"max\"]).asRange(\"Tenure\")}};
q_B = filter q by 'Churn' == "Yes";
result = group q by all full, q_B by all;
result = foreach result generate (count(q_B)/ count(q))*100 as 'churnRate';
Not sure what you mean by unable to add toggle widget above my chart. You just need to push the exisintg chart down by holding the shift key and add the toggle widget just above it, as per the below screenshot !
That is my issue, in my Developer Edition, I'm not able to see this widge
Can I request your help as a similar issue was fixed already in this thread through your guidance. Am referring to the same issue that was faced by Jill Heiremans 44 on April 19, 2020.
My JSON for Tenure Length and Churn Tenure looks like below,
"steps": {
"Tenure_Length_1": {
"broadcastFacet": true,
"columns": {},
"label": "Tenure Length",
"selectMode": "single",
"type": "staticflex",
"values": [
{
"display": "High Risk",
"value": "1 to 12 months",
"min": 1,
"max": 12
},
{
"display": "Medium Risk",
"value": "13 to 24 months",
"min": 13,
"max": 24
},
{
"display": "Low Risk",
"value": "25 to 36 months",
"min": 25,
"max": 36
}
],
"numbers": [],
"strings": [],
"groups": []
},
"Churn_Tenure_1": {
"broadcastFacet": true,
"groups": [],
"label": "Churn Tenure",
"numbers": [],
"query": "q = load \"Beattie_Subs\";\nq = filter q by {{row(Tenure_Length_1.selection,[0],[\"min\",\"max\"]).asRange (\"Tenure\")}};\nq_B = filter q by 'Churn' == \"Yes\";\nresult = group q by all full, q_B by all;\nresult = foreach result generate (count(q_B) / count(q))*100 as 'churnRate';",
"receiveFacetSource": {
"mode": "all",
"steps": []
},
I toggle still doesn’t work and I get the below error as well as Jill received. I double checked the query name and they look correct. Am not sure where am going wrong. Please can you guide me. Thanks in advance.
I get it ! This is a browser issue. Un-zoom your browser and set it to 80% zoom you'll see it :)
Tks for help, so easy to solve, but I'm not get attention on brower zoom
Now am waiting for inupts (for the the issue i detailed above) from Marite/Jill/LinThaw or even you if complete step 2 !
When you say your toggle still does not work -
1. Can you save your work (dashboard).
2. then click on the 'eye' to preview your dashboard.
3. once you are in preview mode, can you click on High Risk; then Medium Risk; then Low Risk?
What numbers do you see in the chart below the toggle? Or do you get an error?
It worked atlast ! Thanks a ton.
May be, i didnt click on the 'eye' one last time :) Ill now proceed ahead with the next challenge.
But before that i wanna take a moment to appreciate the help you are providing to all.
You ROCK !
Yes your QUERY will keep on loading with this line:
q = filter q by {{row(Tenure_Length.selection, [0], [\"min\",\"max\"]).asRange(\"Tenure\")}};
You want to revise this line to:
q = filter q by 'Tenure' >= 0 && 'Tenure' <= 100;
...
...
...
Save that query.
Then, to deploy your bind - you need to click on the chart (not the toggle). Then on the right-hand panel, click on ADVANCED EDITOR.
Then click on the QUERY which is right next to WIDGET.
You will deploy your binding here. You will see :
"query": "q = load \"Beattie_Subs\";\nq = filter q by....
revise the filter q by to this (see the bolded text - that's the binding):
"query": "q = load \"Beattie_Subs\";\nq = filter q by {{row(Tenure_Length_1.selection,[0],[\"min\",\"max\"]).asRange (\"Tenure\")}};\nq_B = filter q by 'Churn' == \"Yes\";\nresult = group q by all full, q_B by all;\nresult = foreach result generate (count(q_B) / count(q))*100 as 'churnRate';",
@marite @pradeep Thanks for your help. My toggle isn't working. not sure whats the issue. can you please have a look. when I click on the toggle to edit I get an error. I think I am missing something. Also please find my Json for the toggle. do I have to also edit this JSON?
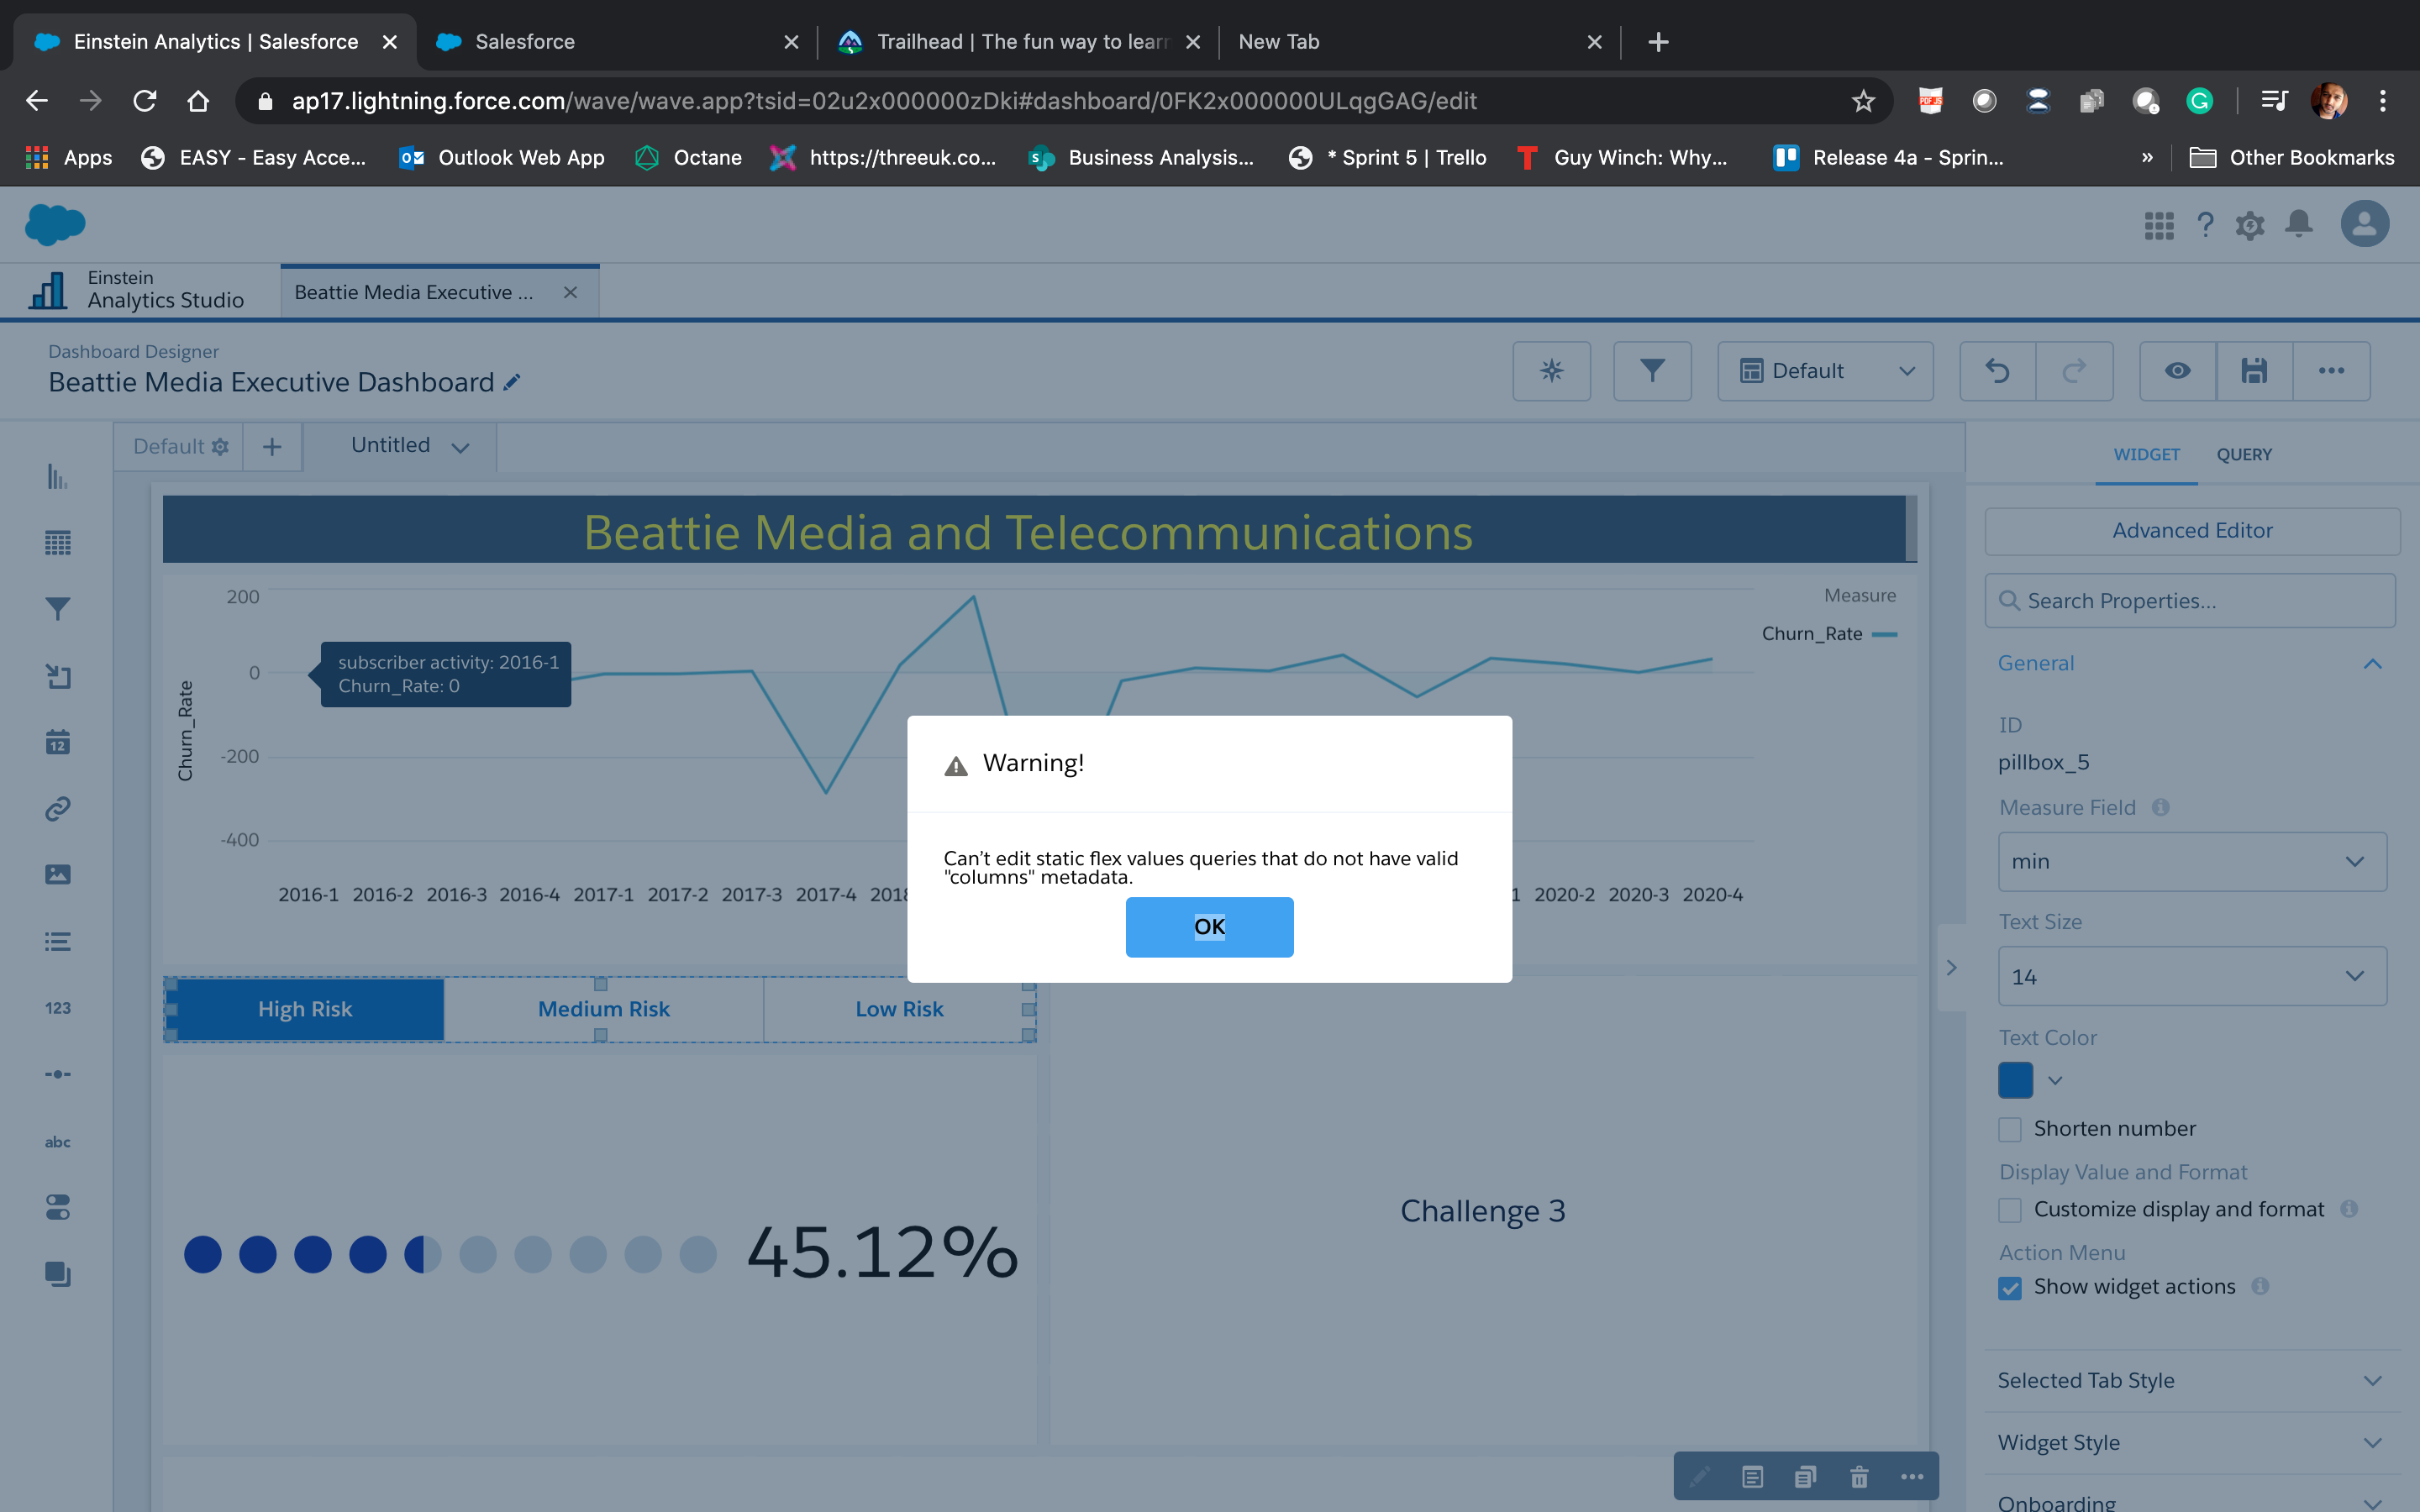
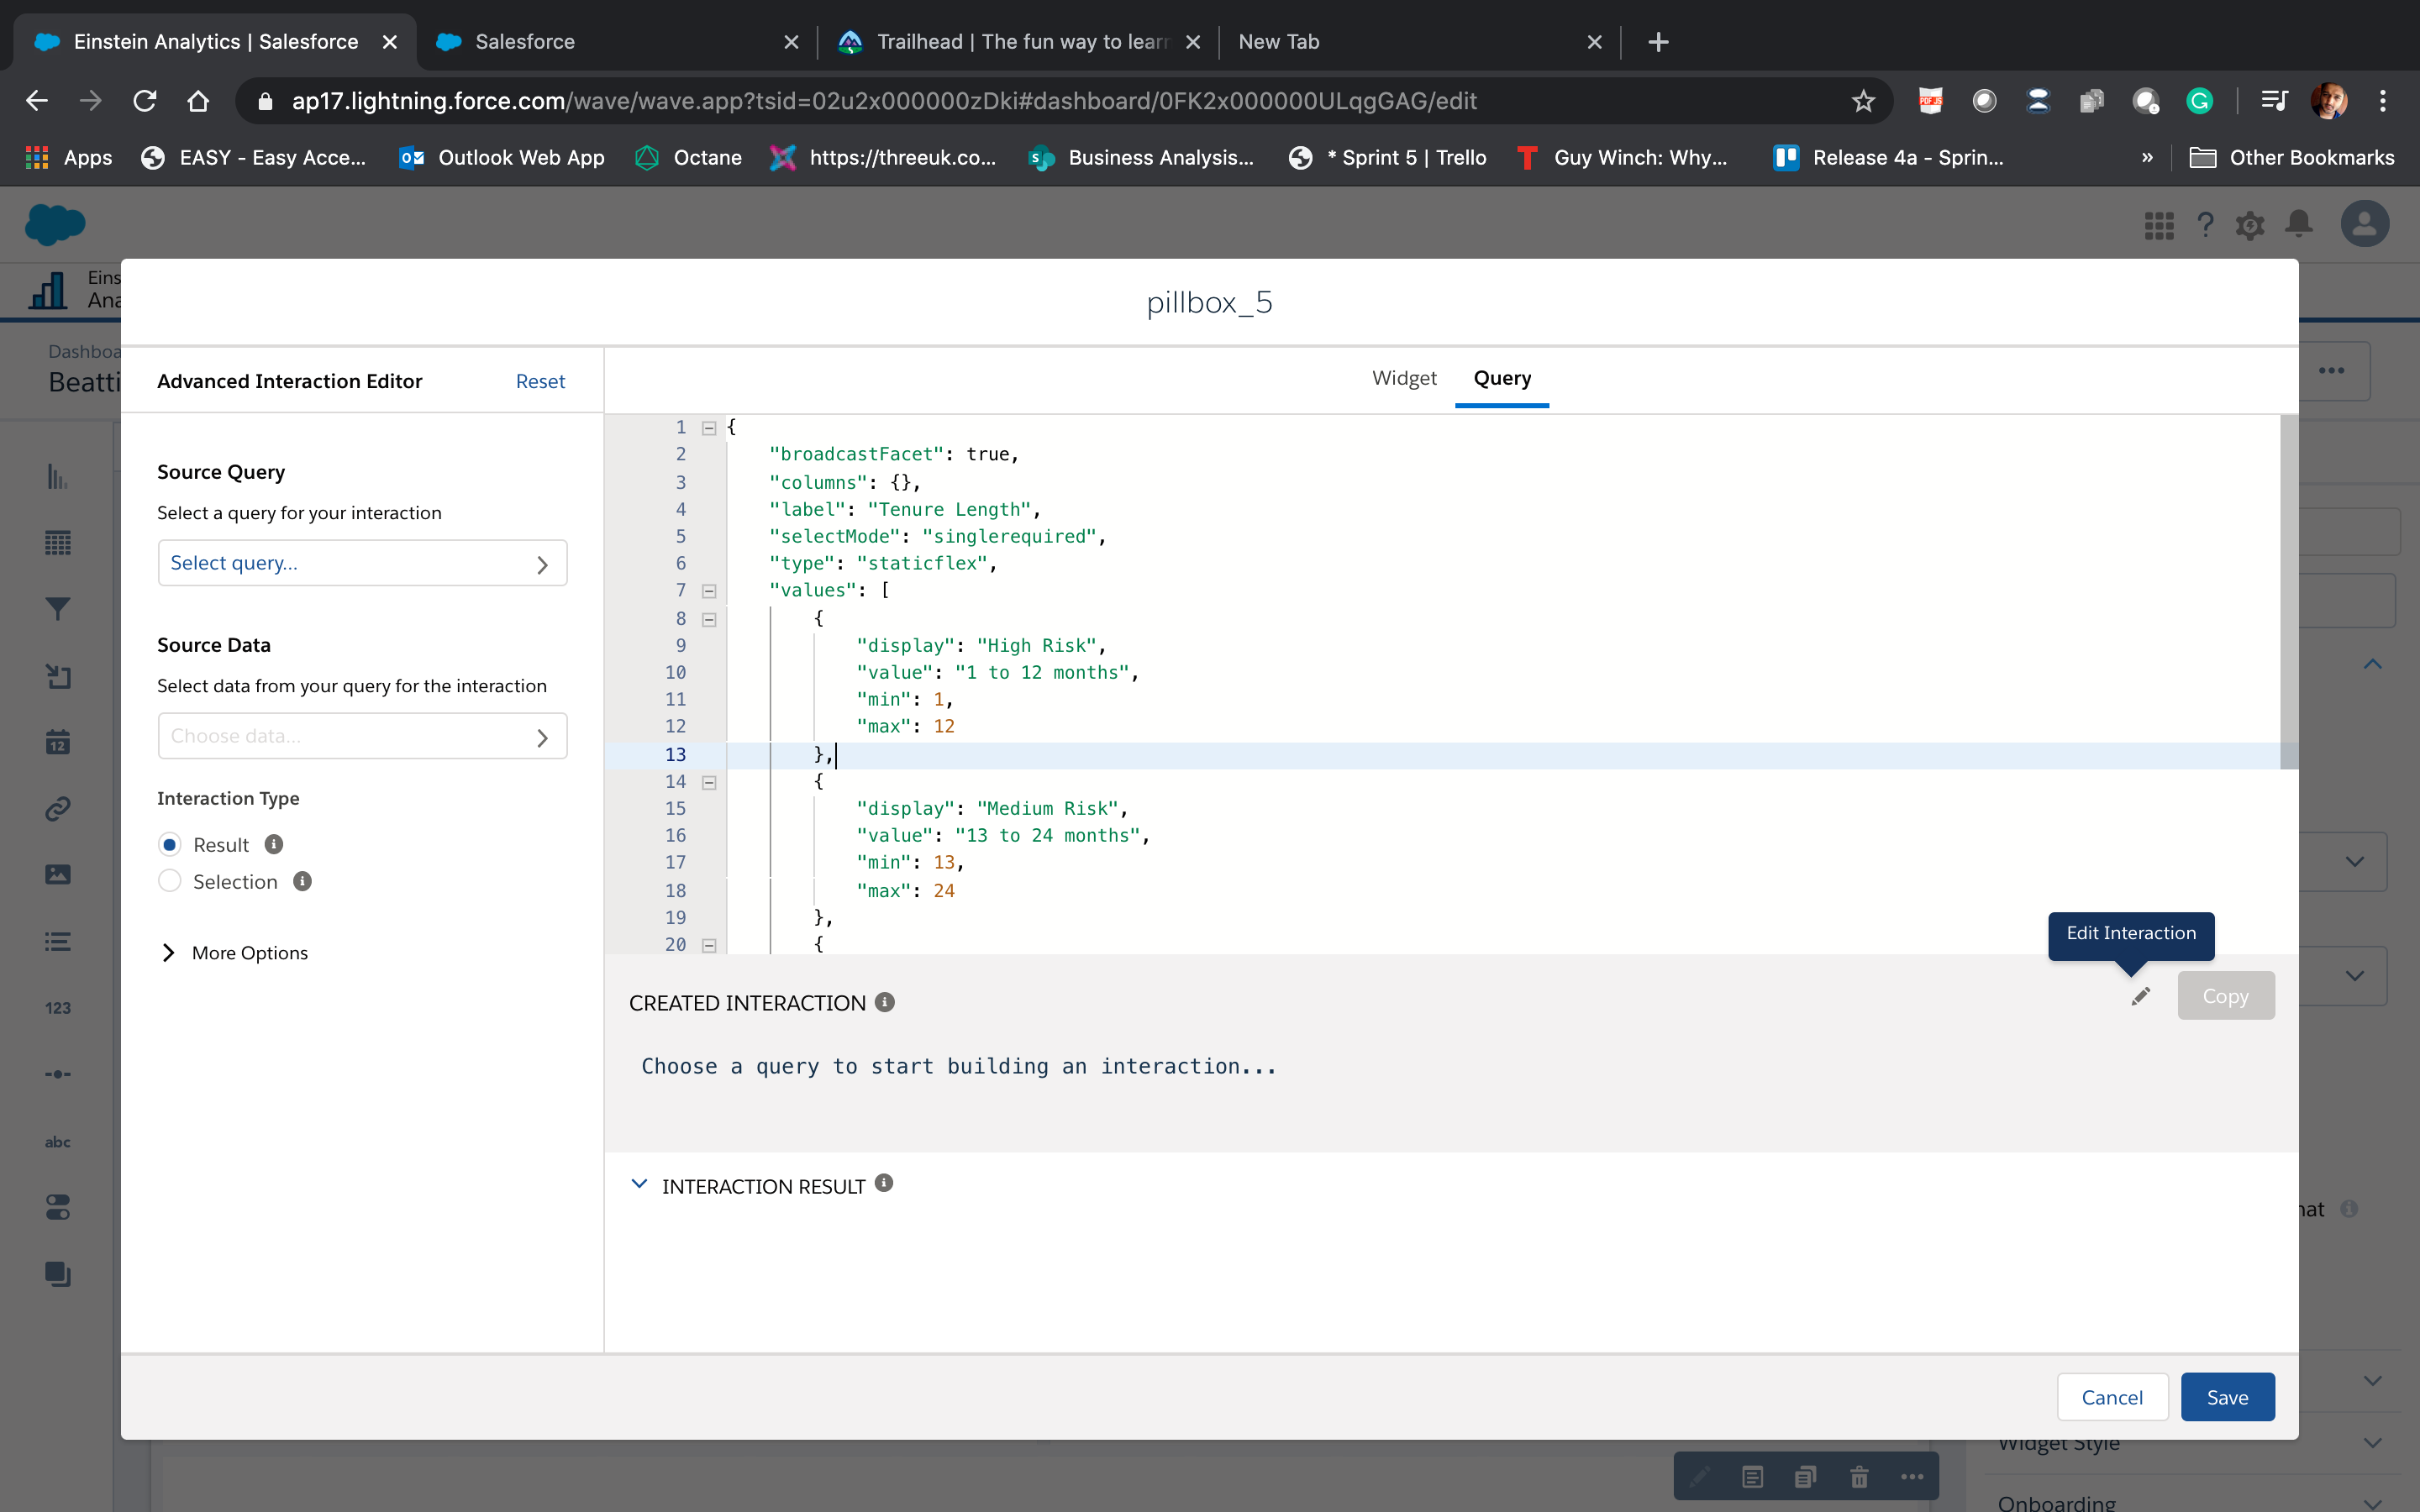
Please find my Tenure lenght JSON below,
{
"broadcastFacet": true,
"columns": {},
"label": "Tenure Length",
"selectMode": "singlerequired",
"type": "staticflex",
"values": [
{
"display": "High Risk",
"value": "1 to 12 months",
"min": 1,
"max": 12
},
{
"display": "Medium Risk",
"value": "13 to 24 months",
"min": 13,
"max": 24
},
{
"display": "Low Risk",
"value": "25 to 36 months",
"min": 25,
"max": 36
}
],
"numbers": [],
"strings": [],
"groups": []
}
Also when I add custom query what should be data type for value column i think it should be number
Thanks, Tushar
You can find the answer in my May 6, 2020 post to Ben. Just do a find for : "Hey Ben," in this thread.
Am facing the same issue as Amit Agarwal. I read the entire thread and I see Amit’s issue was abruptly stopped on May 15 - no updates after that from Amit and neither from you on that issue.
Now that even am in the same stage, I need your help to fix it.
I also read your thread on May 18, 2020 about ‘merged’ dev and am afraid, I didn’t understand it ? Just to clarify from my side, am using the below developer org for these changes. Do you see any issues in using this ? Please suggest. Thanks in advance.
I helped Amit offline. His dev org was merged with another one of his dev. I advised him to create a new dev. Was your trailhead / dev created specifically for this superbadge?
What error are you getting when you check the challenge step? Can you take a snapshot?
Am using this Dev org only for EA courses and superbadges. I get the below error while checking the challenge,
"Challenge Not yet complete... here's what's wrong:
We can't confirm the Subscriber Revenue chart is filtering by the Tenure Length toggle. Confirm there's a binding that filters attrition costs displayed in the reference line"
My JSON is similar to Amit's and i did all the steps exactly like how you mentioned above. I did save and viewed the dashboard and to me it works as expected but i couldnt pass this step due to the before mentioned error !
You should use a unique dev for each superbadge. If your dev was used prior to this superbadge, then I advise you to create a new Einstein Analytics Developer Edition (DE) specifically only for this superbadge. You don't need to redo challenge 1. You can start with challenge 2 on a new dev.
I have completed step 2 according to the given requirements. But I am still getting the below error:
We can't confirm the binding syntax for the Churn Tenure chart. Check that toggle widget selections are updating the Churn Tenure chart. Confirm the binding is using the correct step.
Close errors
Can someone help me solve this?
This could be due to the label and names you used. Can you please:
1. go on to edit mode on your dashboard
2. click any empty cell in your dashboard to display the right hand panel
3. take a snapshot of your right hand panel and post it here.
Can you click on the down arrow of you Tenure Length and then click 'Preview'; then take a snapshot of what you see?
It should look like this (the value column isn't needed but the min, max columns are needed).
Make sure that you did the binding correctly. click on the chart; then click 'Advanced Editor'; then click on Query.
You can copy and paste your QUERY here so I can see if it's correct.
@marite it worked not sure what was the issue.
In the tenure length I changed second column name from tenure length to Display and I unchecked broadcast selections as facets on tenure length
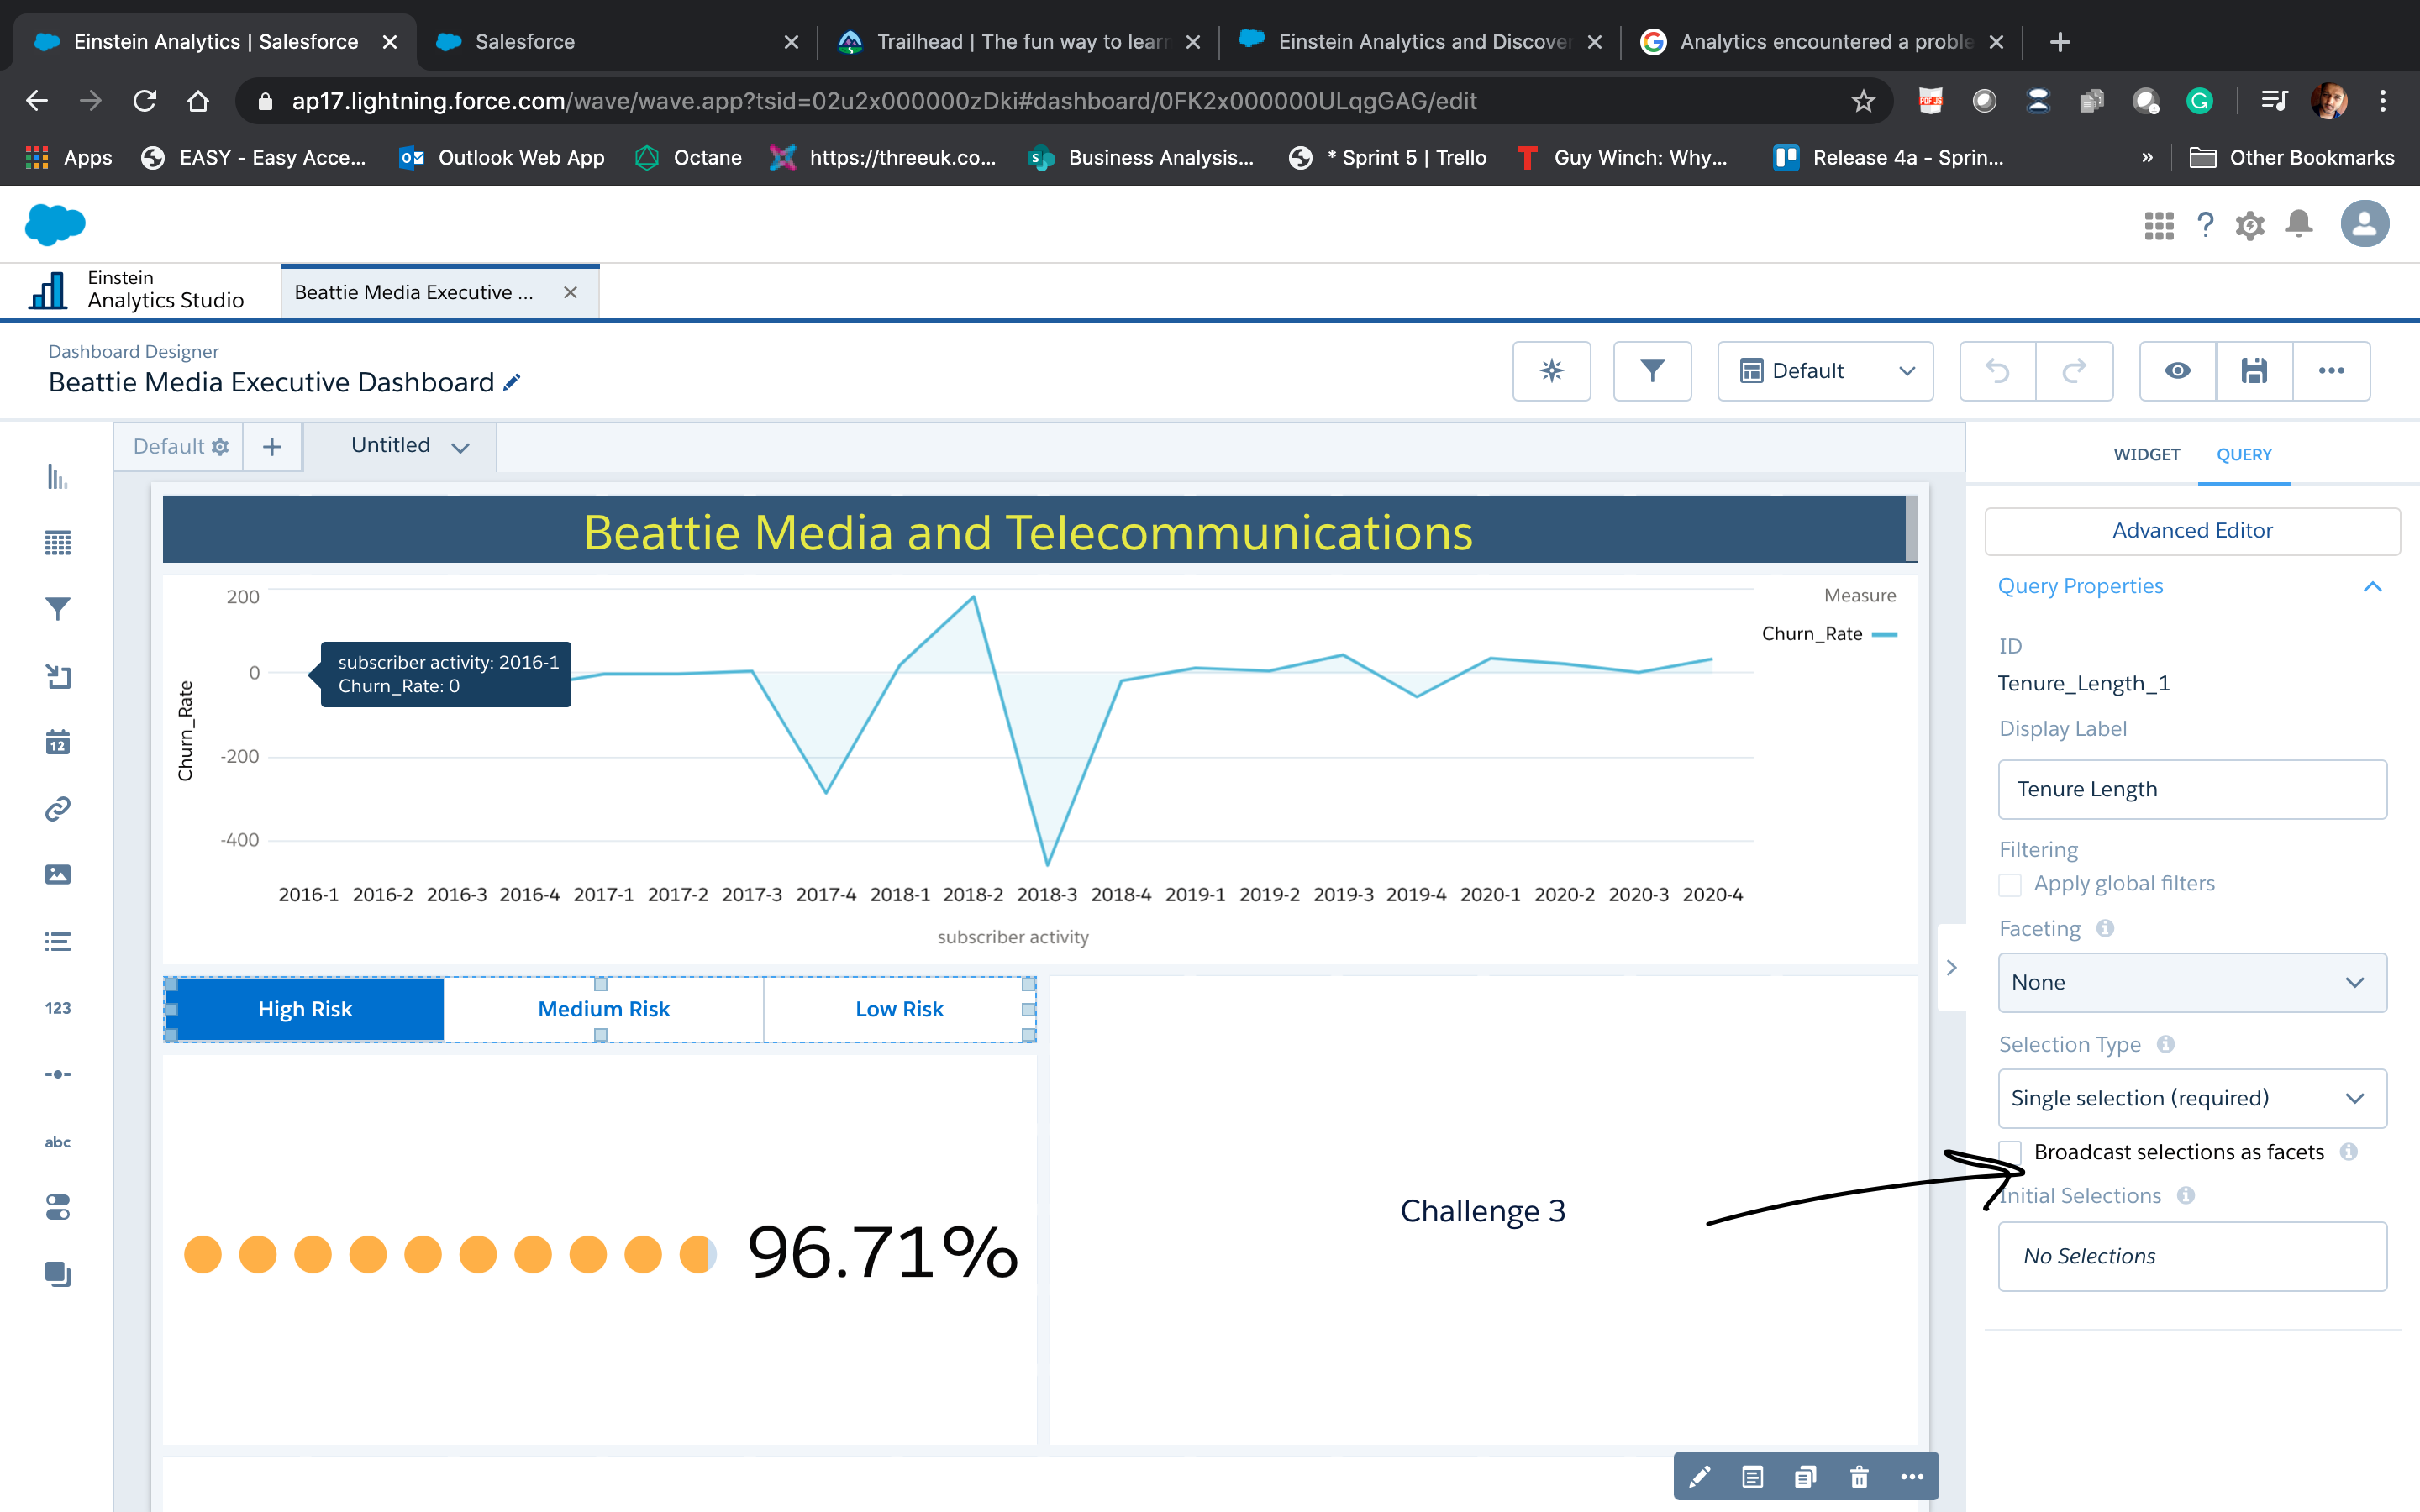
toggle query. and that was the issue I think. Thanks so much for your help. Now time for challenge 3 will bug you again :)))
I have completed all the challenges and eaned the superbadge ! Thanks a ton for your help. You are doing a tremendous job here helping others to climb the ladder.
Here are the screen shots.Can you please help me
@Marite .I figured it out .I went through the labels and realised the tenure length API was incorrect .
Thank you for your help
I'm glad you cleared your issue.
@Marite I am getting below error while doing challenge 3
We can't confirm the Subscriber Revenue chart is filtering by the Tenure Length toggle. Confirm there's a binding that filters attrition costs displayed in the reference line.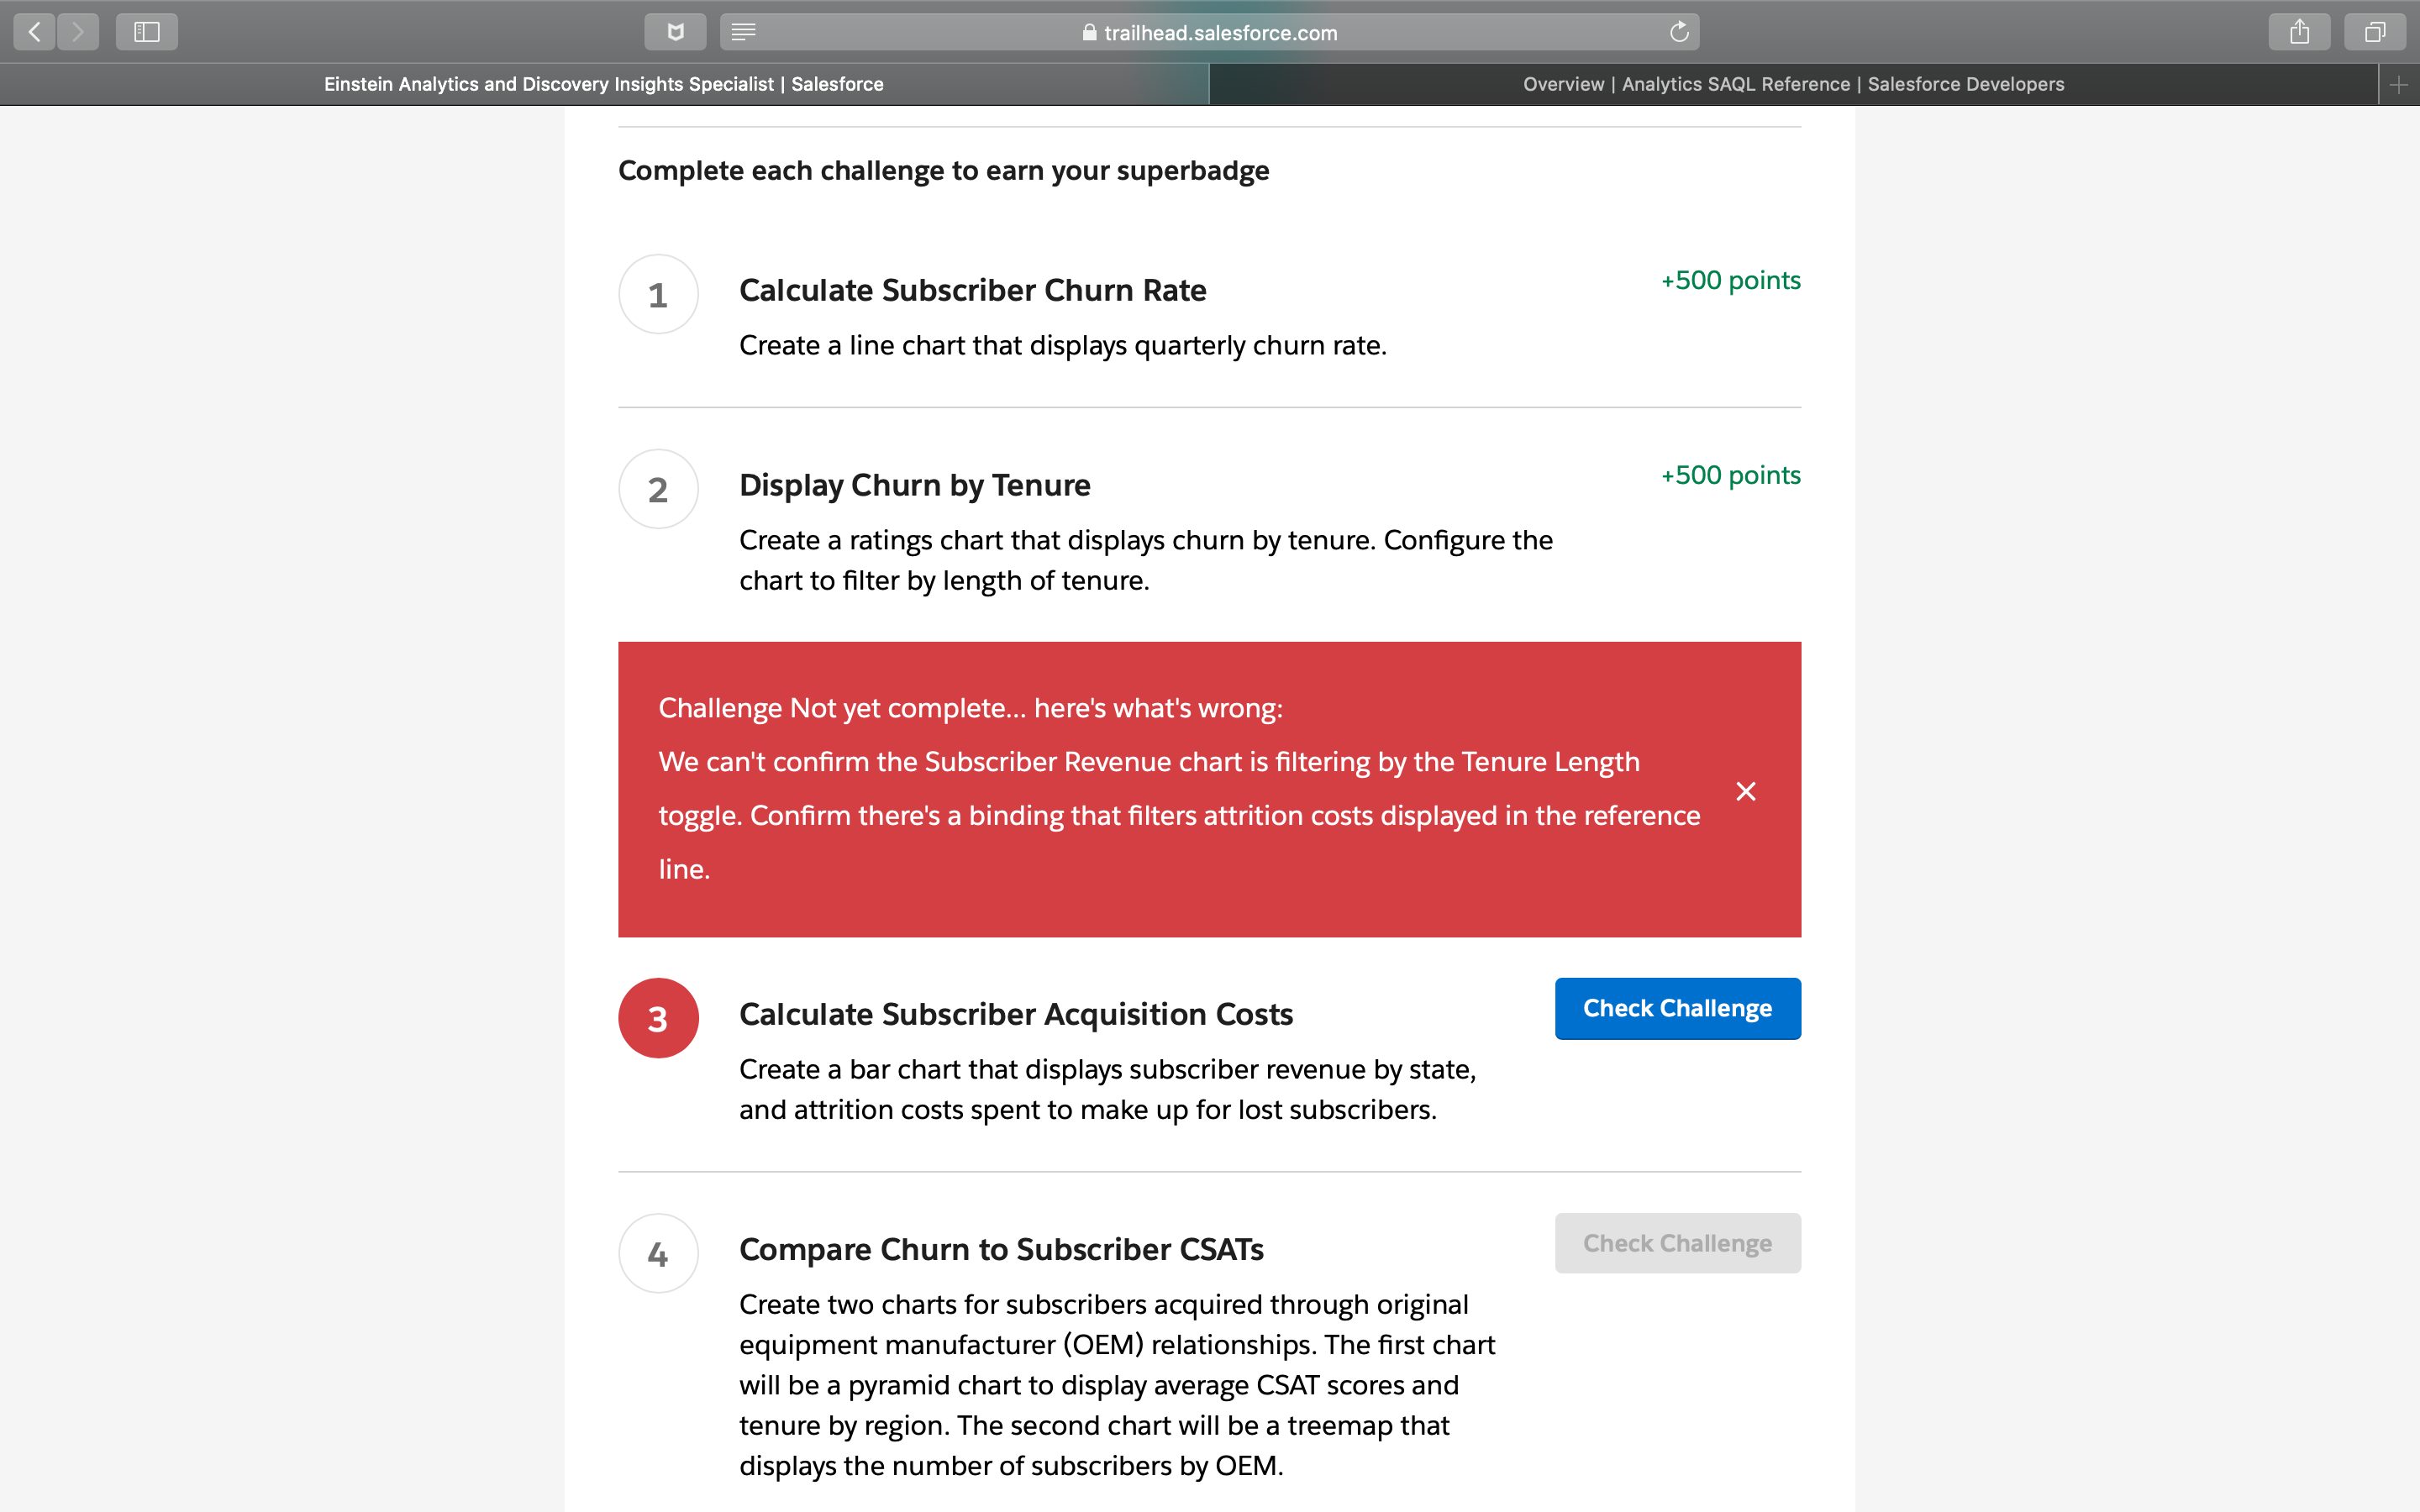
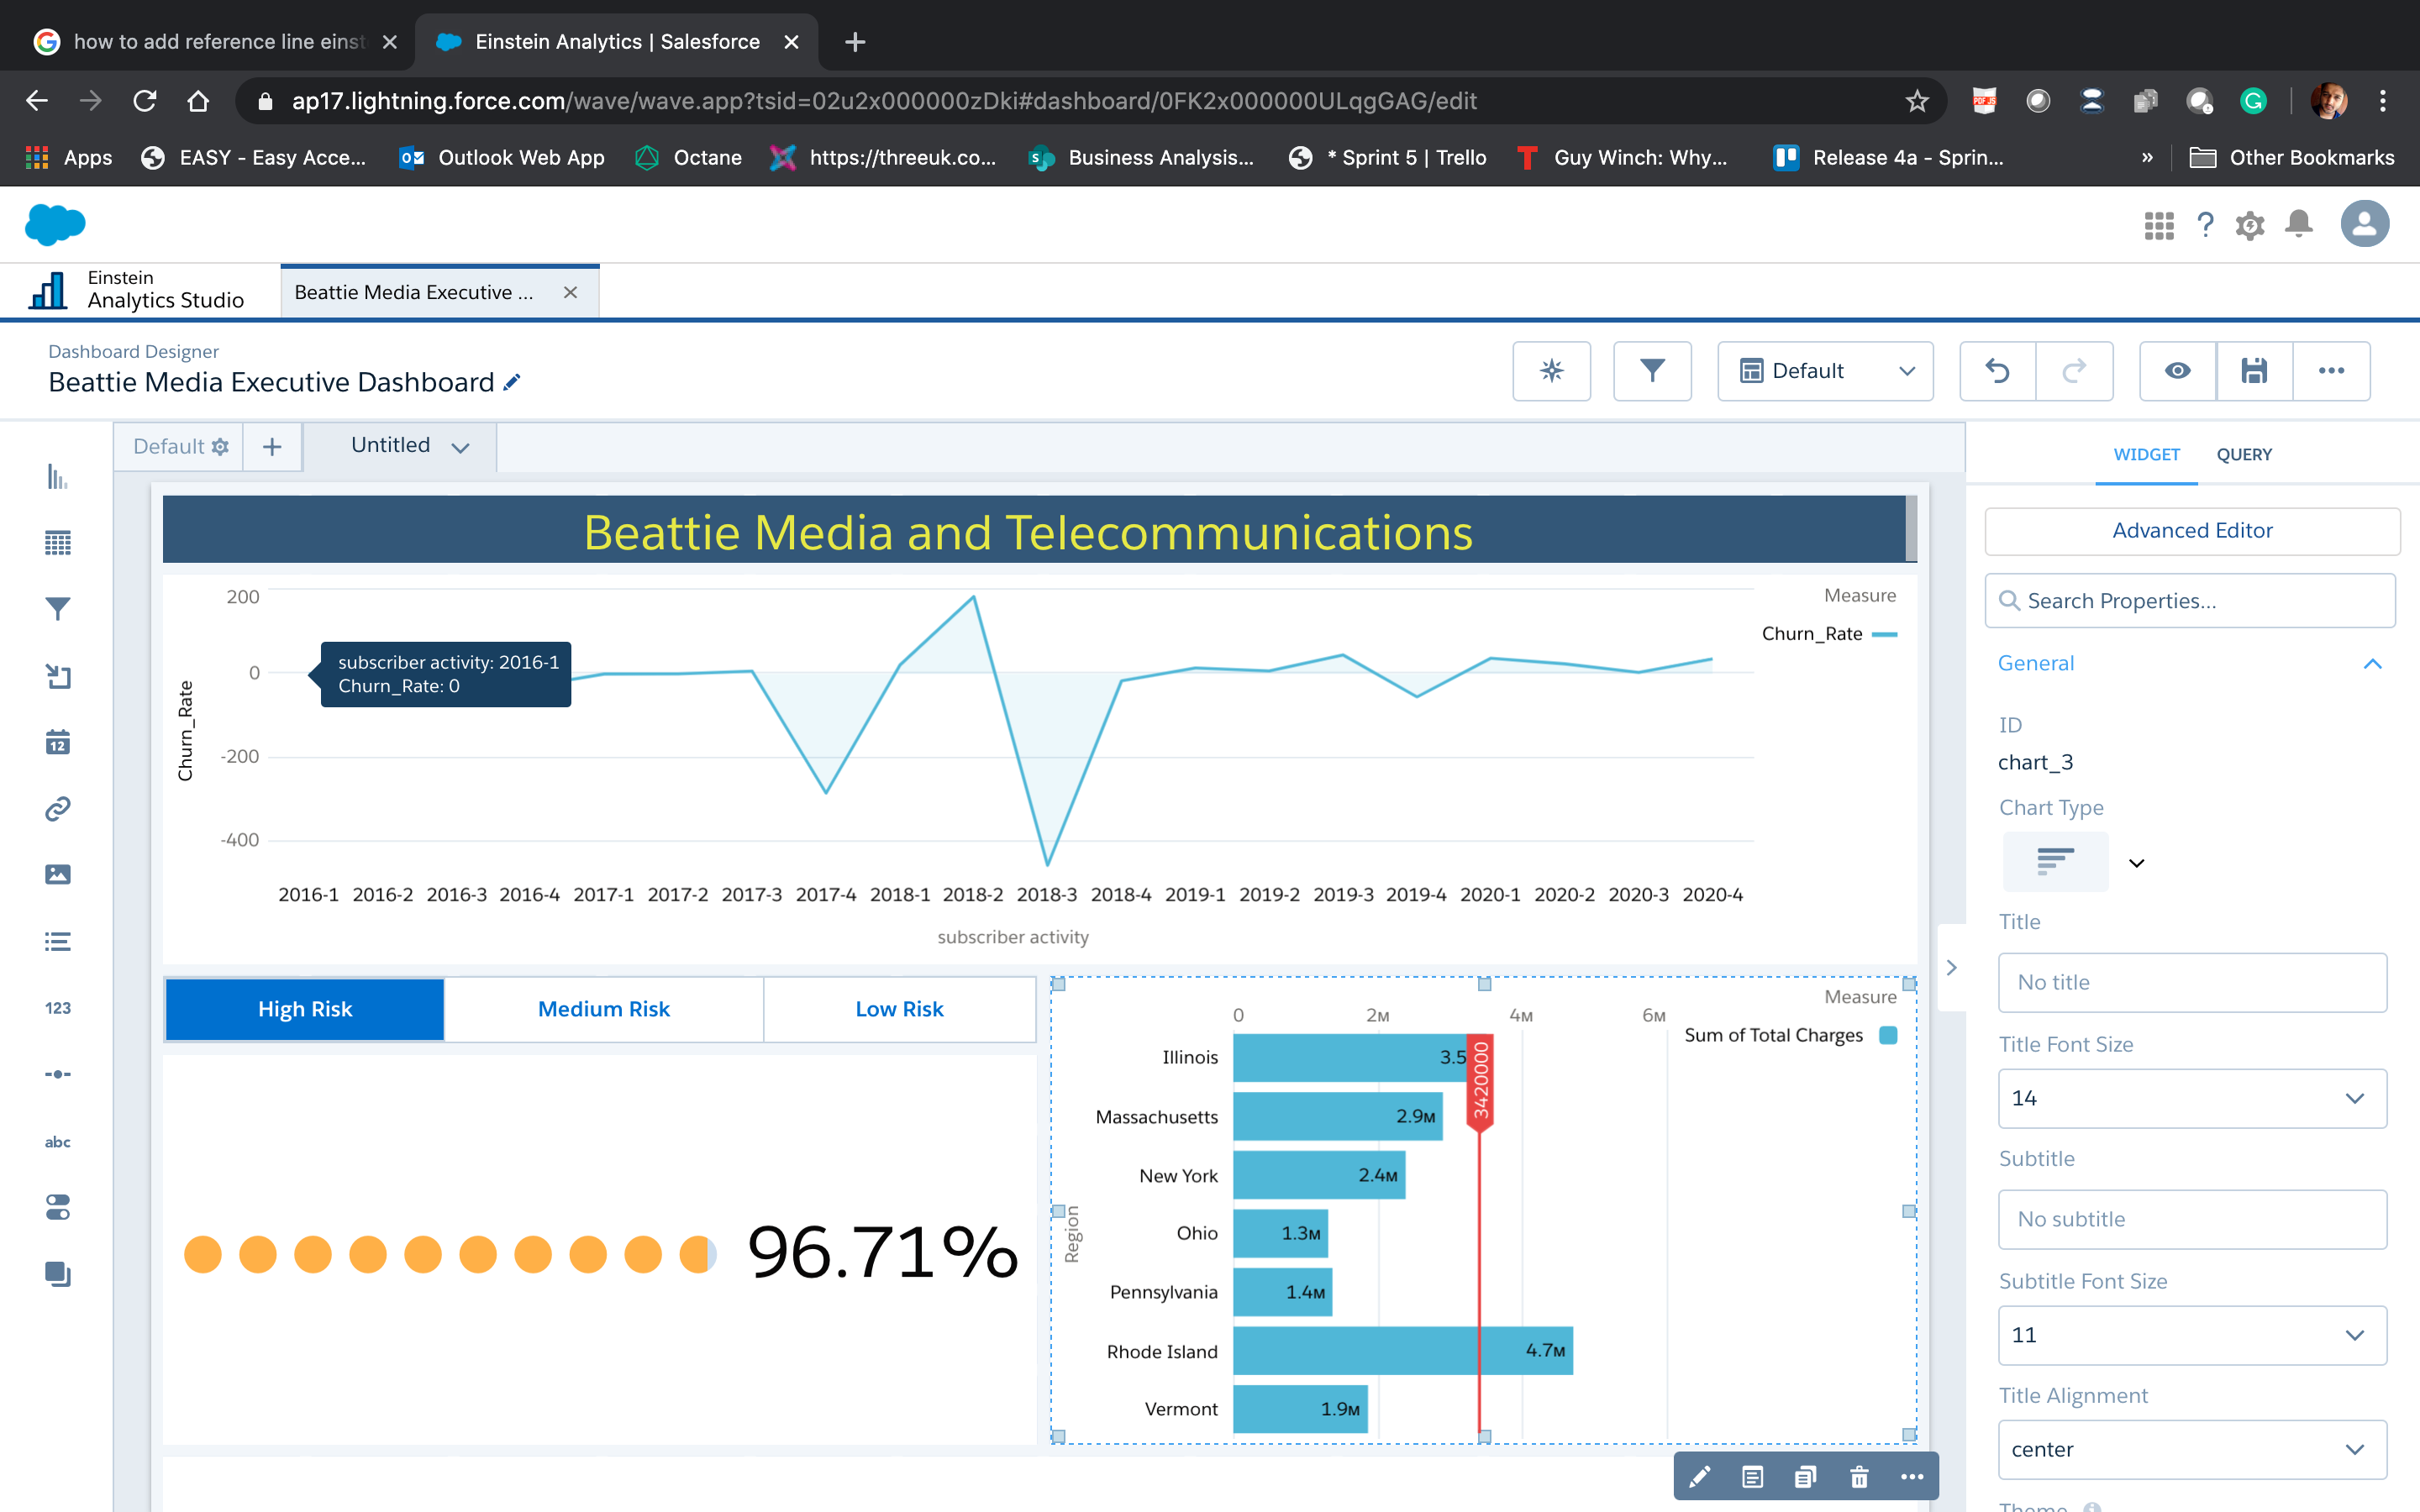
Did you check my May 7, 2020 post which start out with this? Do a find of "You need to create a Subscriber Revenue Query".
1. You need to create a Subscriber Revenue Query.
Can you click on an empty spot in your dashboard and take a snapshot of your screen which also shows the right hand panel?
q = load "Beattie_Subs";
filter q by {{row(Tenure_Length_1.selection,[0],[\"min\", \"max\"]).asRange (\"Tenure\")}};
q_B = filter q by 'Churn' == "Yes";
result = group q by all full, q_B by all;
result = foreach result generate (count(q_B) / count(q))*100 as 'churnRate';
Can anyone help?
Stuck with the challenge 1 . Someone please help on the error.
My graph is starting from 2016-4 instead of 2013 .
code
=====
q = load "Beattie_Subs";
Subscribers = group q by ('Subscription_Date__c_Year', 'Subscription_Date__c_Quarter');
Subscribers = foreach Subscribers generate 'Subscription_Date__c_Year' + "-" + 'Subscription_Date__c_Quarter' as 'ActivityDate_Year-ActivityDate_Quarter', count() as 'Current Quarter Subscribers';
Churns = group q by ('Churn_Date__c_Year', 'Churn_Date__c_Quarter');
Churns = foreach Churns generate 'Churn_Date__c_Year' + "-" + 'Churn_Date__c_Quarter' as 'ActivityDate_Year-ActivityDate_Quarter', count() as 'Current Quarter Churns';
Result = group Subscribers by 'ActivityDate_Year-ActivityDate_Quarter' full, Churns by 'ActivityDate_Year-ActivityDate_Quarter';
Result = foreach Result generate coalesce(Subscribers.'ActivityDate_Year-ActivityDate_Quarter', Churns.'ActivityDate_Year-ActivityDate_Quarter') as 'ActivityDate_Year-ActivityDate_Quarter', sum(Subscribers.'Current Quarter Subscribers') as 'Current Quarter Subscribers', sum(Churns.'Current Quarter Churns') as 'Current Quarter Churns';
Result = group Result by ('ActivityDate_Year-ActivityDate_Quarter', 'Current Quarter Subscribers', 'Current Quarter Churns');
Result = foreach Result generate 'ActivityDate_Year-ActivityDate_Quarter', sum('Current Quarter Subscribers') as 'Current Quarter Subscribers', 'Current Quarter Churns', sum('Current Quarter Subscribers') over ([..-1] partition by all order by 'ActivityDate_Year-ActivityDate_Quarter') - coalesce(sum('Current Quarter Churns') over ([-1..-1] partition by all order by 'ActivityDate_Year-ActivityDate_Quarter'),0) as 'Previous Quarter Subscribers';
Result = foreach Result generate 'ActivityDate_Year-ActivityDate_Quarter', 'Current Quarter Churns'/(coalesce('Previous Quarter Subscribers',0) + coalesce('Current Quarter Subscribers',0)) as 'Churn Rate';
Please assist on the above error
Yes it will go into a look because of the binding you've entered directly into the Query.
Please look at my post to Tushar dated May 19, 2020. Do a find on "Yes your QUERY will keep on loading with this line"
Your SaQL is missing the cogroup of the Subscribers and Churns.
SaQL should first be to generate the Subscribers; then Churns (or vice-versa)
Then; you need to:
1. cogroup the Subs with the Churns
2. then do a coalesce
Thank you for the replay.
The below query is also not working in my case:
q = load "Beattie_Subs";
cancel = group q by ('Churn_Date__c_Year', 'Churn_Date__c_Quarter');
cancel = foreach cancel generate cancel.'Churn_Date__c_Year' + "~~~" + cancel.'Churn_Date__c_Quarter' as 'ActivityDate_Year~~~ActivityDate_Quarter', count() as 'New Quarter Cancellations';
cancel = group cancel by ('ActivityDate_Year~~~ActivityDate_Quarter');
cancel = foreach cancel generate cancel.'ActivityDate_Year~~~ActivityDate_Quarter' as 'ActivityDate_Year~~~ActivityDate_Quarter', coalesce(sum(cancel.'New Quarter Cancellations'),0) as 'New Quarter Cancellations', coalesce(sum(sum('New Quarter Cancellations')) over ([-1 .. -1] partition by all order by ('ActivityDate_Year~~~ActivityDate_Quarter')),0) as 'Previous Quarter Cancellations';
sub = group q by ('Subscription_Date__c_Year', 'Subscription_Date__c_Quarter');
sub = foreach sub generate sub.'Subscription_Date__c_Year' + "~~~" + sub.'Subscription_Date__c_Quarter' as 'ActivityDate_Year~~~ActivityDate_Quarter', count() as 'New Quarter Subcribers';
sub = group sub by ('ActivityDate_Year~~~ActivityDate_Quarter');
sub = foreach sub generate sub.'ActivityDate_Year~~~ActivityDate_Quarter' as 'ActivityDate_Year~~~ActivityDate_Quarter', coalesce(sum(sub.'New Quarter Subcribers'),0) as 'New Quarter Subcribers', coalesce(sum(sum('New Quarter Subcribers')) over ([.. 0] partition by all order by ('ActivityDate_Year~~~ActivityDate_Quarter')),0) as 'Previous Quarter Subcribers';
result = cogroup sub by 'ActivityDate_Year~~~ActivityDate_Quarter' full, cancel by 'ActivityDate_Year~~~ActivityDate_Quarter';
result = foreach result generate coalesce(sub.'ActivityDate_Year~~~ActivityDate_Quarter', cancel.'ActivityDate_Year~~~ActivityDate_Quarter') as 'ActivityDate_Year~~~ActivityDate_Quarter', sum(cancel.'New Quarter Cancellations')/(sum(sub.'New Quarter Subcribers') + sum(sub.'Previous Quarter Subcribers') - sum(cancel.'Previous Quarter Cancellations')) * 100 as 'Churn Rate';
This works. Please compare yours:
q = load "Beattie_Subs";
cancel = group q by ('Churn_Date_Year', 'Churn_Date_Quarter');
cancel = foreach cancel generate cancel.'Churn_Date_Year' + "~~~" + cancel.'Churn_Date_Quarter' as 'ActivityDate_Year~~~ActivityDate_Quarter', count() as 'New Quarter Cancels';
cancel = group cancel by ('ActivityDate_Year~~~ActivityDate_Quarter');
cancel = foreach cancel generate cancel.'ActivityDate_Year~~~ActivityDate_Quarter' as 'ActivityDate_Year~~~ActivityDate_Quarter', coalesce(sum(cancel.'New Quarter Cancels'),0) as 'New Quarter Cancels', coalesce(sum(sum('New Quarter Cancels')) over ([-1..-1] partition by all order by ('ActivityDate_Year~~~ActivityDate_Quarter')),0) as 'Previous Quarter Cancels';
sub = group q by ('Subscription_Date_Year', 'Subscription_Date_Quarter');
sub = foreach sub generate sub.'Subscription_Date_Year' + "~~~" + sub.'Subscription_Date_Quarter' as 'ActivityDate_Year~~~ActivityDate_Quarter', count() as 'New Quarter Subs';
sub = group sub by ('ActivityDate_Year~~~ActivityDate_Quarter');
sub = foreach sub generate sub.'ActivityDate_Year~~~ActivityDate_Quarter' as 'ActivityDate_Year~~~ActivityDate_Quarter', coalesce(sum(sub.'New Quarter Subs'),0) as 'New Quarter Subs', coalesce(sum(sum('New Quarter Subs')) over ([-1..0] partition by all order by ('ActivityDate_Year~~~ActivityDate_Quarter')),0) as 'Previous Quarter Subs';
result = cogroup sub by 'ActivityDate_Year~~~ActivityDate_Quarter' full, cancel by 'ActivityDate_Year~~~ActivityDate_Quarter';
result = foreach result generate coalesce(sub.'ActivityDate_Year~~~ActivityDate_Quarter', cancel.'ActivityDate_Year~~~ActivityDate_Quarter') as 'ActivityDate_Year~~~ActivityDate_Quarter', sum(cancel.'New Quarter Cancels')/(sum(sub.'New Quarter Subs') + sum(sub.'Previous Quarter Subs') - sum(cancel.'Previous Quarter Cancels')) as 'Churn Rate';
Thank You for the response.
I figured out the issue.
Created a new org and done everything once again and it worked.
The changes that I made.
1) Instaed of using the browser 'Microsoft Edge' used Chrome for development.
2) Uploaded the Beattie Subs.csv file directly into a dataset rather than through the dataflow.
I thought of sharing it, since if some one is stuck with the first step, this will be helpful for them :)
With Regards,
Nisha
I have Stucked in challange 2
I have created the tresure length like this
and my Query/json is like below:
"Tenure_Lenght_1": {
"broadcastFacet": true,
"columns": {
"min": {
"type": "string"
},
"max": {
"type": "string"
},
"value": {
"type": "string"
},
"Display": {
"type": "string"
}
},
"label": "Tenure Lenght",
"selectMode": "single",
"type": "staticflex",
"values": [
{
"Display": "High Risk",
"min": 1,
"max": 12,
"value": "1 to 12 months"
},
{
"Display": "Medium Risk",
"min": 13,
"max": 24,
"value": "13 to 24 months"
},
{
"Display": "Low Risk",
"min": 25,
"max": 36,
"value": "25 to 36 months"
}
]
},
have tried with the query :
q = load "Beattie_Subs"; filter q by {{row(Tenure_Length_1.selection,[0],[\"min\",\"max\"]).asRange (\"Tenure\")}};q_B = filter q by 'Churn' == "Yes"; result = group q by all full, q_B by all; result = foreach result generate (count(q_B) / count(q))*100 as 'churnRate';
but it's not returning and also not showing an error , it look like it's loading but i waited for 30-40 mins it's not returning with results . Still showing it's loading.
Please helpme here! Thanks in advance!
Check out your label/name of Tenure_Lenght in your JSON.
Your query uses Tenure_Length
You just transposed "gth" - "ght"
Thankyou for your response, I have chnaged the label.Still same issue
When you write your query, you should not write it with the binding : " {{row(Tenure_Length_1.selection,[0],[\"min\",\"max\"]).asRange (\"Tenure\")}}". Adding the binding right away will cause it to 'loop' as the query cannot run on unknown variables.
Please read my post to Tushar on May 19, 2020.
I have done in that way i.e i have added the Query in the dashboard json also, but toggles are not working.
The Above post by you solved my issue.Thankyou very much.
I have this issue here where I cannot see the Create A Step button on the right panel, just the Create Query function.
I need to create steps in order to create the Length of Tenure.
Any help?
Click on 'Create Query' (see right hand panel); then this will pop-up. Look at the bottom for "Create Custom Query' and this will enable you to create a static Query.
Just passed the Step #2 of the superbadge. I want to express my sincere appreciation to you. You are a rockstar!
Thank you,
Gabriel
Can you suggest any links/reference materials/Qizlet etc., for preparing for the Einstein Analytics and Discovery Consultant (SP20) exam? I know most of us have completed the super badges and preparing for the exam. Thanks in advance.
Kelsey Shannon also organised the review path quite nicely: https://medium.com/@kshannon565/salesforce-einstein-analytics-certification-study-guide-91b9cdd92862
A few in-depth explanation from Rikke Hovegaard : https://www.salesforceblogger.com/author/rikkehovgaard-org/ for example about Bindings; timeseries, etc.
Doing the 2 superbadges for Einstein Analytics will definitely help.
Let's not pretend that quizlets and sets of 'questions' in the internet do not exist. They do not have the right answers though. Even if you try these, it will not guarantee that it will allow you to pass the test unless you find out and UNDERSTAND the answers and explanation for yourselves.
I prepared for a couple of months and very intensely the last month and I made sure to UNDERSTAND the how and why's; based my review path on Kelsey's and Daniel's advice.
I have a specific gripe about the questions related to Einstein Discovery. The questions often show more than 1 plausible answer and I felt were quite subjective (all depends on how you want to get on with your Client and work with the client to help them understand their data and limitations).
I passed the test but I did not pass it with flying colours. The Einstein Discovery (which is 19% of the total exam) pulled down my overall score - and I really put a lot of time and effort into studying Einstein Discovery. There just isn't sufficient material on it and like I said - I feel that answers were subjective. And of course, Salesforce will not show which specific answers were wrong.
If you are taking the online exam, make sure that you go to the bathroom before you take the test and do not drink a lot of liquid before the test. There was no way for me to communicate to the proctor that my bladder was bursting and so I had to submit the exam despite having another 35 - 40 minutes to go to review with a fine tooth comb.
I would encourage others as well (who have cleared the exam already) to publish the reference materials/links/videos etc., that you used for the exam preparation.
Let’s all succeed by helping one another !
There was an unhandled exception. Please reference ID: LXUYZBXH. Error: Restforce::ResponseError. Message: 550: Value [include] for field [Receive Facet Source - Mode] can't be downgraded to API version 44.0.
Looking for some advice on how to proceed on this challenge..
Can you describe here what you did for faceting and binding for Challenge 3?
Usually the 550 errors are resolved by using a new and clean trailhead/dev instance.
Step 5.
Error : We can't confirm 'Predicted Tenure' was selected as the story outcome. Confirm your story's recommendation is 'Predicted Tenure' and your story outcome field is 'Predicted Tenure'..
any help on these,
This challenge has been revised and it is a lot easier. No need to do the Apex Trigger or the process builder. What I think could be your issue is when you deployed your model. Did you name your Prediction Name and Story Outcome field as 'Predicted Tenure'? The Story Outcome is defined in the step before this 'confirm your deployment setting'.
Perhaps you got caught between the switch from old to new version of the challenge?
From what I can tell the new version checks if you have removed variables that could cause data leaks.
The new version also specifically instructs and checks that you have included contract and payment method.
Maybe you can do step 5 using a new dev instance?
Apparently the exam can include a question relating to the steps for Writeback, so knowledge of its steps can be useful.
With my try of the new version, I checked only these 4 variables: subscription date (using month as the trend); payment method; contract; and modem.
There was only 1 question related to writeback in the exam.
I am left one last Challenge in Einstein Analytics and Discovery Insights Specialist Superbadge.
The thing is i'm getting Error "Challenge Not yet complete... here's what's wrong:
We did not find the correct field level security for the Predicted Tenure field." eventhough i have given access to my profile (Read-only). No luck even after giving access to all the profiles.
Can anyone provide your valuable solutions !.
Field Security for Predicted_Tenure cannot be read only because Discovery needs to put a value in it. You need to select VISIBLE (top checkbox just to be sure).
It looks like I am missing something while mapping the fields. I have choosen only the 4 fields as decribed above in one of the posts. what could be the problem here?
Please go here and look
https://success.salesforce.com/_ui/core/chatter/groups/GroupProfilePage?g=0F9300000009MBP&fId=0D53A00004vEm7Q&s1oid=00D300000000iTz&emkind=chatterCommentNotification&s1nid=0DB30000000072L&emtm=1592222824852&s1uid=0053A00000F18wv&fromEmail=1&s1ext=0
While working on step 5, when I try to add the Einstein Predictions card to the Subscriber page, "Predicted Tenure" does not show up when I go to search for it in Prediction on the right hand side of the screen. Is there a permission that I am missing?
The Prediction shows up properly in the Einstein Prediction Builder:
Thanks for your help!
Ashley
I got "We did not find the correct field level security for the Predicted Tenure field." error message when forgot to add "Predicted Tenure" field to "All Subscribers" list view. Please check.
@Navaneetha Nataraj 24, don't overthink it too much, i spent a lot of time trying out models by manually selecting and reselecting predicting variables with different strategies (chosing variables with highest correlation, lowest correlation ..) then ended up trying the automatic selection which ended up the working model, although it choosed 'Account Number' as a predicting variable ... which is complete nonsense. The final model includes the following variables (Subscription Date, Modem Age, Postal Code, Name, Account Number, Region, Payment Method, Contract, Online Security, Tech Support, Online Backup, Internet Service).
@Taras Mandzak, you need to go to the Subscriber Object in the Object Manager, then Fields and relationships, then click the Predicted Tenure field and set Field Level Security to Visible for your profile (which should be System Administrator).
Hope thes helps,
Good luck.
According to new challenge for step 5 ?
If completed can anyone please provide the steps fore new challenge.
Thanks in advance.
@Ahmed Djallel BOUISRI can you please tell the steps to complete challenge 5
- Create the Einstein Discovery Story from the model
- Select Maximize Tenure as story goal, Insight & Predictions as story type
- Include the following variables in manual mode : Subscription Date, Modem Age, Postal Code, Name, Account Number, Region, Payment Method, Contract, Online Security, Tech Support, Online Backup, Internet Service
- Deploy the Prediction
- Go to the model reated from the story, and select Deploy Model
- Name the prediction as 'Predicted Tenure'
- Connect the predictionto the Subscriber Object
- Leave the mapping as is (All fields should be mapped)
- Create a new prediction field and name it as 'Predicted Tenure'
- Ignore Monitor Model Accuracy
- Select Contract and Payment Method as Action Variables (if you can't see all the variables, zoom out with your browser)
- Add Einstein Prediction Lightning Card to Subscriber Record Lightning Page
- Using the Lightning App Builder, Create a Record Page named 'Default' for the Subscriber Object
- Choose Clone Salesforce Default Page and select Grouped View Default
- Drag and drop the Einstein Predictions Lightning Component into the Right Side Panel and choose 'Predicted Tenure'
- Activate the page and assign it as Org Default for the Desktop
- Add Prediction field to Subscriber List View
- Using Object Manager, set the Field Level Security to 'Visible' for your profile (should be System Admin)
- Create a new List View and name it 'All Subscribers'
- Include: Subscriber Name, Predicted Tenure and any other fields you wish to show up and save the list view
And you should be all set,good luck.
Cheers.
Thanks for your suggestion. No need to overthink. Last challenge is straight forward, need to follow the instructions as it is then would be able to clear it.
LinThaw,
Challenge 5:
Challenge Not yet complete... here's what's wrong:
We can't confirm 'Predicted Tenure' was selected as the story outcome. Confirm your story's recommendation is 'Predicted Tenure' and your story outcome field is 'Predicted Tenure'.
can any one help me.......................
Challenge Not yet complete... here's what's wrong:
We can't confirm 'Predicted Tenure' was selected as the story outcome. Confirm your story's recommendation is 'Predicted Tenure' and your story outcome field is 'Predicted Tenure'.
We can't confirm you mapped the correct fields on the Tenure model. Check the model fields, make sure to avoid using fields that may cause data leakage, and try again.
I reviewed all of the data and removed everything that appeared as data leakage and deployed the model. I get the error. I've found 2-3 different people who have listed out what fields they selected or didn't select and deployed the model (and just re-deployed to the already created Predicted Tenure). I get the error.
I've tried Subscription Date as-is, with the week selected, with the both selected, and with both the week and month selected. After each change, I Deploy the model and select the already created Predicted Tenure.
I've also deleted the Story, made it again, and tried various field suggestions. I've done the Manual and the Automatic creation of the Story. No dice.
Fields:
It is very frustrating to be stuck at this point as I am sure the other areas are all correct for this Challenge. I'm truly at a loss on what I could do differently.
I've seen this happen when the DEV instance is MERGED with other dev instances. You might want to start with a new DEV instances and go directly to Challenge 5 - then use Ahmed Djallel BOUISRI's step by step.
Make sure that you do not merge the new DEV instance with your main DEV or other DEV instances that you are using.
Subscription Date, Modem Age, Postal Code, Region, Payment Method, Contract, Online Security, Tech Support, Online Backup, Internet Service
A prior list that did not pass the trail check (see error message below) is:
Subscription Date, Modem Age, Postal Code, Region, Payment Method, Contract
To that end, the below error message is very generic and the emphasis in this csae is on simply "... Check the model fields" and not so much about "... fields that may cause data leakage ...
"We can't confirm you mapped the correct fields on the Tenure model. Check the model fields, make sure to avoid using fields that may cause data leakage, and try again."
@Mareite, I created a whole new dev org and followed the exact steps outlined and I'm still getting the same data leakage error. This is terribly frustrating!
"Challenge Not yet complete... here's what's wrong:
We can't confirm 'Predicted Tenure' was selected as the story outcome. Confirm your story's recommendation is 'Predicted Tenure' and your story outcome field is 'Predicted Tenure'."
I had named my first model Predicted tenure but, that resulted in the error message about not being able to confirm selected action variables. The salesforce representitive sugested that I change the name to "Tenure". Once I did that I started to recive the afformentioned error.
If anyone has any insights or suggestions it would be greatly appreciated.
Thank you in advance
@Ahmed Djallel BOUISRI Please help me, where is supposed to be the Subscriber Tab? I can't see it. I belive that it should be inside the Sales.
I'm really stuck, I don't know where do I have to create the list view "All subscribers"
Could anybody help me on Challenge 2:
my Code is working well, I can Toggle and Filtering will happen.
But I get the error when wanting to verificate:
Here is my query:"query": "q = load \"Beattie_Subs\";\nq = filter q by {{row(static_1.selection, [0], [\"min\", \"max\"]).asRange(\"Tenure\")}};\nq_A = filter q by 'Churn' == \"Yes\";\nresult = group q by all full, q_A by all;\nresult = foreach result generate sum(q_A.'Tenure') as 'churnedSubscribers', sum(q.'Tenure') as 'TotalNumberOfSubscribers';\nresult = foreach result generate 'churnedSubscribers', 'TotalNumberOfSubscribers', churnedSubscribers / TotalNumberOfSubscribers as 'C';"
Please help me with this :)
my Code is working well, I can Toggle and Filtering is working as expected.
But I get the error when wanting to verification
and this is my Tenure Length Step
and this is my tenure chart query
q = load \"Beattie_Subs\";\r\nq = filter q by {{row(Tenure_Length_2.selection,[0],[\"Min\",\"Max\"]).asRange(\"Tenure\")}}; \r\nq_B = filter q by 'Churn' == \"Yes\";\r\nresult = group q by all full, q_B by all;\r\nresult = foreach result generate( count(q_B) / count(q)) * 100 as 'churnRate';"
Please help me in resolving this...
Thanks in advance !!!!!!!!
I'm little bit confused about the tenature length for step 2. Created following query but, not able to get proper results.
q = load "Beattie_Subs";
q = filter q by date('Subscription_Date_Year', 'Subscription_Date_Month', 'Subscription_Date_Day') in [dateRange([2019,11,1], [2020,10,31])];
q_a= filter q by 'Churn'=="Yes";
result= group q by all, q_a by all;
result= foreach result generate count(q_a)/count(q) as 'A';
please guide me for the filter I've to use for line 2 :)
" We can't confirm you mapped the correct fields on the Tenure model. Make sure you only have one model under your prediction, check the model fields, avoid using fields that may cause data leakage, and try again. "
The error isn't very clear not helps you get to a solution.
The following fields list works :
I am stuck on CRM Analytics and Einstein Discovery Insights Specialist Superbadge step 5.
Can anyone help with the step. In Deploy Einstein Discovery Prediction, create a new Prediction Field and label it as Predicted Tenure. How to create the field as I am not getting then option in Deploy Model.
I need your help regarding Power BI and DAX Forumulas (https://blog.enterprisedna.co/). I wanna ask, is there any training or course where I can get latest and updated knowledge to expand my analuytical thinking?
I came across the same issue. were you able to figure out a solution?
Hope that helps...
Hello guys,
I'm still stuck on the step 1, I getting the error below:
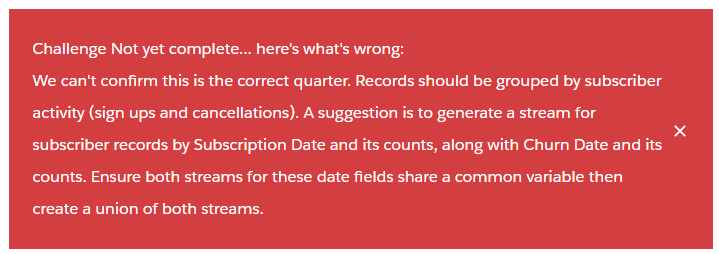
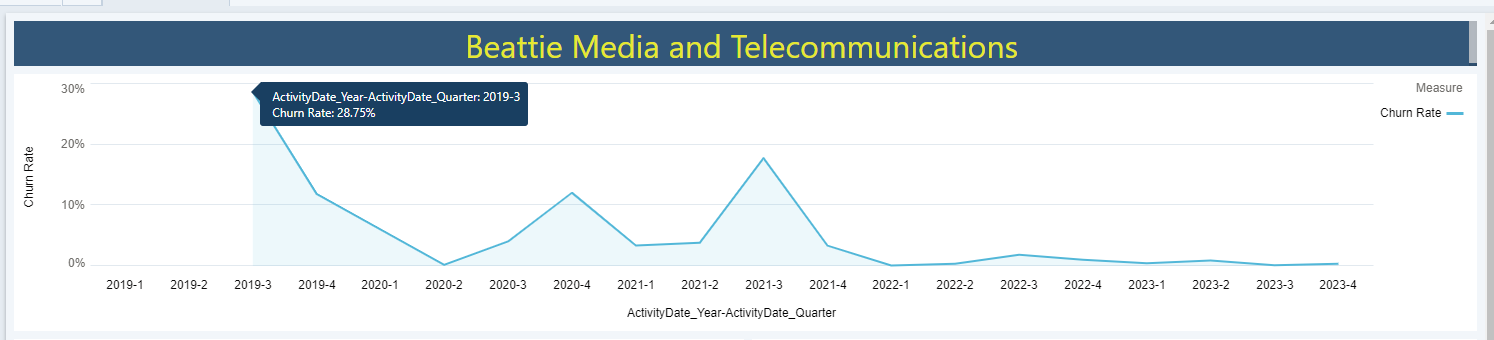
And there is my code and graphic.
q = load "Beattie_Subs";

Subscribers = group q by ('Subscription_Date_Year', 'Subscription_Date_Quarter');
Subscribers = foreach Subscribers generate 'Subscription_Date_Year' + "-" + 'Subscription_Date_Quarter' as 'ActivityDate_Year-ActivityDate_Quarter', count() as 'Current Quarter Subscribers';

Churns = group q by ('Churn_Date_Year', 'Churn_Date_Quarter');
Churns = foreach Churns generate 'Churn_Date_Year' + "-" + 'Churn_Date_Quarter' as 'ActivityDate_Year-ActivityDate_Quarter', count() as 'Current Quarter Churns';

Result = group Subscribers by 'ActivityDate_Year-ActivityDate_Quarter' full, Churns by 'ActivityDate_Year-ActivityDate_Quarter';
Result = foreach Result generate coalesce(Subscribers.'ActivityDate_Year-ActivityDate_Quarter', Churns.'ActivityDate_Year-ActivityDate_Quarter') as 'ActivityDate_Year-ActivityDate_Quarter', sum(Subscribers.'Current Quarter Subscribers') as 'Current Quarter Subscribers', sum(Churns.'Current Quarter Churns') as 'Current Quarter Churns';
Result = group Result by ('ActivityDate_Year-ActivityDate_Quarter', 'Current Quarter Subscribers', 'Current Quarter Churns');
Result = foreach Result generate 'ActivityDate_Year-ActivityDate_Quarter', sum('Current Quarter Subscribers') as 'Current Quarter Subscribers', 'Current Quarter Churns', sum('Current Quarter Subscribers') over ([..-1] partition by all order by 'ActivityDate_Year-ActivityDate_Quarter') - coalesce(sum('Current Quarter Churns') over ([-1..-1] partition by all order by 'ActivityDate_Year-ActivityDate_Quarter'),0) as 'Previous Quarter Subscribers';
Result = foreach Result generate 'ActivityDate_Year-ActivityDate_Quarter', 'Current Quarter Churns'/(coalesce('Previous Quarter Subscribers',0) + coalesce('Current Quarter Subscribers',0)) as 'Churn Rate';
If someone knows and can explain how i can finish it, it would be really helpfull and gratefull.
Thanks,
Leonardo.
We can't confirm you mapped the correct fields on the Tenure model. Make sure you only have one model under your prediction, check the model fields, avoid using fields that may cause data leakage, and try again.