


 Apex Code Development
 You need to sign in to do that
Don't have an account?
Super Badge - Einstein Analytics e Discovery Insights - Challenge 1
Hi Devs!
I'm a new adventurer in Salesforce and I don't have so much knowledge in developing. So I'm learning about Einstein Analytics and it is my first Superbadge in Trailhead.
I did the previous requires perfectly, like upload files and organize my org, so my question is:
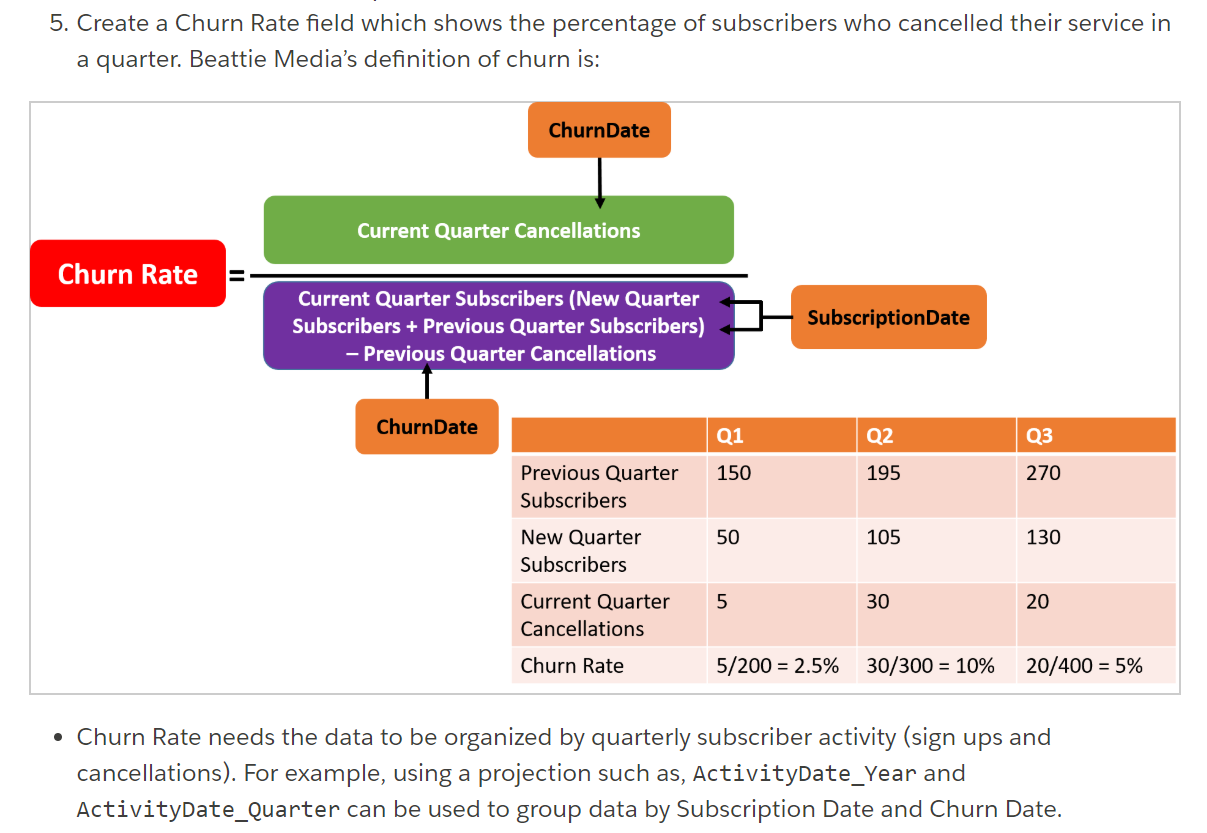
- The first challenge says to do a graph that shows a churn rate (like a image below), but I cannot undertand how to do this formula. I need to do this using SAQL? Can you help me showing how I proceed to do this graph?
Thanks for help! I'm beginner in Salesforce World and I need to get knowledge in this great software!
I'm a new adventurer in Salesforce and I don't have so much knowledge in developing. So I'm learning about Einstein Analytics and it is my first Superbadge in Trailhead.
I did the previous requires perfectly, like upload files and organize my org, so my question is:
- The first challenge says to do a graph that shows a churn rate (like a image below), but I cannot undertand how to do this formula. I need to do this using SAQL? Can you help me showing how I proceed to do this graph?
Thanks for help! I'm beginner in Salesforce World and I need to get knowledge in this great software!
Follow below steps.
1.Load the dataset into q
filter q into a new stream (cancellations) by Churn (you want the number of cancellations, so set the churn bit appropriately)
2.Group cancellations by ChurnDate year/quarter but project the date as ActivityDate year/quarter; count() as current quarter cancellations,
3.you then need to lag cancellations by one period, so generate again but this time collect 'cancellations' by sum and in a separate column, include a window function with sum to pick up the prior period. I won't tell you have to do it, but read up on windowing
4.group q by Subscription_Date year/quarter
5.generate a count() for "subscribers" and like above, project subscription_date year/quarter as ActiviityDate year/quarter.
6.re-generate the stream from step 6 as a sum of "subscribers" and add lagged subscribers by the same windowing sum that you did for cancelllations.
7.then you can either cogroup with a full join on ActivityDate year/quarter (and then generate the formula you need) or union and regroup by ActivityDate year/quarter.
Refer below thread for similar discussion.
https://developer.salesforce.com/forums/?id=9062I000000g5xRQAQ
Please mark it as solved if my reply was helpful. It will make it available for other as the proper solution.
Best Regards
Sandhya
here is the ode I used :
q = load "Beattie_Subs"; cancel = group q by ('Churn_Date_Year', 'Churn_Date_Quarter'); cancel = foreach cancel generate cancel.'Churn_Date_Year' + "~~~" + cancel.'Churn_Date_Quarter' as 'ActivityDate_Year~~~ActivityDate_Quarter', count() as 'New Quarter Cancellations'; cancel = group cancel by ('ActivityDate_Year~~~ActivityDate_Quarter'); cancel = foreach cancel generate cancel.'ActivityDate_Year~~~ActivityDate_Quarter' as 'ActivityDate_Year~~~ActivityDate_Quarter', coalesce(sum(cancel.'New Quarter Cancellations'),0) as 'New Quarter Cancellations', coalesce(sum(sum('New Quarter Cancellations')) over ([-1..-1] partition by all order by ('ActivityDate_Year~~~ActivityDate_Quarter')),0) as 'Previous Quarter Cancellations'; sub = group q by ('Subscription_Date_Year', 'Subscription_Date_Quarter'); sub = foreach sub generate sub.'Subscription_Date_Year' + "~~~" + sub.'Subscription_Date_Quarter' as 'ActivityDate_Year~~~ActivityDate_Quarter', count() as 'New Quarter Subcribers'; sub = group sub by ('ActivityDate_Year~~~ActivityDate_Quarter'); sub = foreach sub generate sub.'ActivityDate_Year~~~ActivityDate_Quarter' as 'ActivityDate_Year~~~ActivityDate_Quarter', coalesce(sum(sub.'New Quarter Subcribers'),0) as 'New Quarter Subcribers', coalesce(sum(sum('New Quarter Subcribers')) over ([-1..0] partition by all order by ('ActivityDate_Year~~~ActivityDate_Quarter')),0) as 'Previous Quarter Subcribers'; result = cogroup sub by 'ActivityDate_Year~~~ActivityDate_Quarter' full, cancel by 'ActivityDate_Year~~~ActivityDate_Quarter'; result = foreach result generate coalesce(sub.'ActivityDate_Year~~~ActivityDate_Quarter', cancel.'ActivityDate_Year~~~ActivityDate_Quarter') as 'ActivityDate_Year~~~ActivityDate_Quarter', sum(cancel.'New Quarter Cancellations')/(sum(sub.'New Quarter Subcribers') + sum(sub.'Previous Quarter Subcribers') - sum(cancel.'Previous Quarter Cancellations')) as 'Churn Rate';Hi ,
I'm experiencing this error in step 1:
Challenge Not yet complete... here's what's wrong:
We can't find the result on your chart or the wrong quarter was identified. Confirm a marker was added to your chart.
q = load "Beattie_Subs";
cancel = group q by ('Churn_Date_Year', 'Churn_Date_Quarter');
cancel = foreach cancel generate cancel.'Churn_Date_Year' + "~~~" + cancel.'Churn_Date_Quarter' as 'ActivityDate_Year~~~ActivityDate_Quarter', count() as 'New Quarter Cancellations';
cancel = group cancel by ('ActivityDate_Year~~~ActivityDate_Quarter');
cancel = foreach cancel generate cancel.'ActivityDate_Year~~~ActivityDate_Quarter' as 'ActivityDate_Year~~~ActivityDate_Quarter', coalesce(sum(cancel.'New Quarter Cancellations'),0) as 'New Quarter Cancellations', coalesce(sum(sum('New Quarter Cancellations')) over ([..-1] partition by all order by ('ActivityDate_Year~~~ActivityDate_Quarter')),-1) as 'Previous Quarter Cancellations';
sub = group q by ('Subscription_Date_Year', 'Subscription_Date_Quarter');
sub = foreach sub generate sub.'Subscription_Date_Year' + "~~~" + sub.'Subscription_Date_Quarter' as 'ActivityDate_Year~~~ActivityDate_Quarter', count() as 'New Quarter Subcribers';
sub = group sub by ('ActivityDate_Year~~~ActivityDate_Quarter');
sub = foreach sub generate sub.'ActivityDate_Year~~~ActivityDate_Quarter' as 'ActivityDate_Year~~~ActivityDate_Quarter', coalesce(sum(sub.'New Quarter Subcribers'),0) as 'New Quarter Subcribers', coalesce(sum(sum('New Quarter Subcribers')) over ([..-1] partition by all order by ('ActivityDate_Year~~~ActivityDate_Quarter')),0) as 'Previous Quarter Subcribers';
result = cogroup sub by 'ActivityDate_Year~~~ActivityDate_Quarter' full, cancel by 'ActivityDate_Year~~~ActivityDate_Quarter';
result = foreach result generate coalesce(sub.'ActivityDate_Year~~~ActivityDate_Quarter', cancel.'ActivityDate_Year~~~ActivityDate_Quarter') as 'ActivityDate_Year~~~ActivityDate_Quarter', (sum(cancel.'New Quarter Cancellations')/(sum(sub.'New Quarter Subcribers') + sum(sub.'Previous Quarter Subcribers') - sum(cancel.'Previous Quarter Cancellations')))*100 as 'Churn Rate';
--new cancellations grouping and calculations
cancel_1 = group q
by (
'Churn_Date_Year',
'Churn_Date_Quarter'
);
cancel_1 = foreach cancel_1
generate
cancel_1.'Churn_Date_Year' + " - " + cancel_1.'Churn_Date_Quarter' as 'Cancellation Activity',
count() as 'Current Quarter Cancellations';
--previous cancellations calculations with (current cancellations)
cancel_2 = group cancel_1
by ('Cancellation Activity');
cancel_2 = foreach cancel_2
generate
cancel_2.'Cancellation Activity' as 'Cancellation Activity',
coalesce(
sum(cancel_2.'Current Quarter Cancellations'),
0
) as 'Current Quarter Cancellations',
coalesce(
sum(sum('Current Quarter Cancellations'))
over(
[-1..-1]
partition by all
order by ('Cancellation Activity')
),
0
) as 'Previous Quarter Cancellations';
--new subscribers grouping and calculations
sub_1 = group q
by (
'Subscription_Date_Year',
'Subscription_Date_Quarter'
);
sub_1 = foreach sub_1
generate
sub_1.'Subscription_Date_Year' + " - " + sub_1.'Subscription_Date_Quarter' as 'Subscriber Activity',
count() as 'New Quarter Subcribers';
--previous subscribers calculations with (current subscribers)
sub_2 = group sub_1
by ('Subscriber Activity');
sub_2 = foreach sub_2
generate
sub_2.'Subscriber Activity' as 'Subscriber Activity',
coalesce(
sum(sub_2.'New Quarter Subcribers'),
0
) as 'New Quarter Subcribers',
coalesce(
sum(sum('New Quarter Subcribers'))
over(
[-1..0]
partition by all
order by ('Subscriber Activity')
),
0
) as 'Previous Quarter Subcribers';
--calculating rating
result = cogroup
sub_2 by 'Subscriber Activity' full,
cancel_2 by 'Cancellation Activity';
result = foreach result
generate
coalesce(
sub_2.'Subscriber Activity',
cancel_2.'Cancellation Activity'
) as 'Subscriber Activity',
sum(cancel_2.'Current Quarter Cancellations') /
(
sum(sub_2.'New Quarter Subcribers') +
sum(sub_2.'Previous Quarter Subcribers') -
sum(cancel_2.'Previous Quarter Cancellations')
) as 'Churn Rate';
--after adding it to the dashboard add a cart marker to the first quarter point
q = load "Beattie_Subs";
cancel = group q by ('Churn_Date_Year', 'Churn_Date_Quarter');
cancel = foreach cancel generate cancel.'Churn_Date_Year' + "~~~" + cancel.'Churn_Date_Quarter' as 'ActivityDate_Year~~~ActivityDate_Quarter', count() as 'New Quarter Cancellations';
cancel = group cancel by ('ActivityDate_Year~~~ActivityDate_Quarter');
cancel = foreach cancel generate cancel.'ActivityDate_Year~~~ActivityDate_Quarter' as 'ActivityDate_Year~~~ActivityDate_Quarter', coalesce(sum(cancel.'New Quarter Cancellations'),0) as 'New Quarter Cancellations', coalesce(sum(sum('New Quarter Cancellations')) over ([..-1] partition by all order by ('ActivityDate_Year~~~ActivityDate_Quarter')),-1) as 'Previous Quarter Cancellations';
sub = group q by ('Subscription_Date_Year', 'Subscription_Date_Quarter');
sub = foreach sub generate sub.'Subscription_Date_Year' + "~~~" + sub.'Subscription_Date_Quarter' as 'ActivityDate_Year~~~ActivityDate_Quarter', count() as 'New Quarter Subcribers';
sub = group sub by ('ActivityDate_Year~~~ActivityDate_Quarter');
sub = foreach sub generate sub.'ActivityDate_Year~~~ActivityDate_Quarter' as 'ActivityDate_Year~~~ActivityDate_Quarter', coalesce(sum(sub.'New Quarter Subcribers'),0) as 'New Quarter Subcribers', coalesce(sum(sum('New Quarter Subcribers')) over ([..-1] partition by all order by ('ActivityDate_Year~~~ActivityDate_Quarter')),0) as 'Previous Quarter Subcribers';
result = cogroup sub by 'ActivityDate_Year~~~ActivityDate_Quarter' full, cancel by 'ActivityDate_Year~~~ActivityDate_Quarter';
result = foreach result generate coalesce(sub.'ActivityDate_Year~~~ActivityDate_Quarter', cancel.'ActivityDate_Year~~~ActivityDate_Quarter') as 'ActivityDate_Year~~~ActivityDate_Quarter', (sum(cancel.'New Quarter Cancellations')/(sum(sub.'New Quarter Subcribers') + sum(sub.'Previous Quarter Subcribers') - sum(cancel.'Previous Quarter Cancellations')))*100 as 'Churn Rate';
And Added a marker on the first Quarter of the Chart .
It worked for me ..
Please mark it as solved if my reply was helpful. It will make it available for other as the proper solution.
Regards
Harsh