


 Apex Code Development
 You need to sign in to do that
Don't have an account?
[java]Export report csv through connected app
Hey there,
I've just started looking at the reporting / analytics API, and I'm not really loving how insanely difficult it is to work with. Somehow I went from:
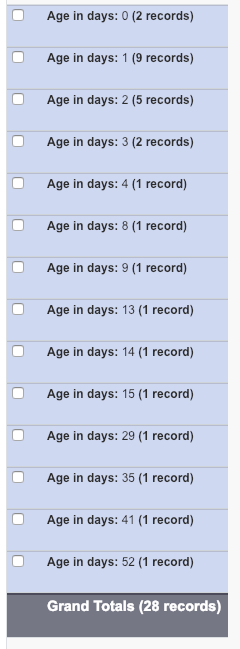
to
(GET /services/data/v44.0/analytics/reports/<id>/)
This is absolutely INSANE. How the.... is ANYONE supposed to parse this nonsense? The field labels are garbage and I don't see any kind of mappings explained in the file itself.
Given that the JSON response from the analytics is completely and totally unusable, is there some way to call the analytics API to generate me the csv? I didn't see anything in the API -- but the JSON is horrid...
I've just started looking at the reporting / analytics API, and I'm not really loving how insanely difficult it is to work with. Somehow I went from:
to
(GET /services/data/v44.0/analytics/reports/<id>/)
"factMap": {
        "13!T": {
            "aggregates": [
                {
                    "label": "1",
                    "value": 1
                }
            ]
        },
        "0!T": {
            "aggregates": [
                {
                    "label": "2",
                    "value": 2
                }
            ]
        },
        "12!T": {
            "aggregates": [
                {
                    "label": "1",
                    "value": 1
                }
            ]
        },
        "1!T": {
            "aggregates": [
                {
                    "label": "9",
                    "value": 9
                }
            ]
        },
        "10!T": {
            "aggregates": [
                {
                    "label": "1",
                    "value": 1
                }
            ]
        },
        "11!T": {
            "aggregates": [
                {
                    "label": "1",
                    "value": 1
                }
            ]
        },
        "2!T": {
            "aggregates": [
                {
                    "label": "5",
                    "value": 5
                }
            ]
        },
        "T!T": {
            "aggregates": [
                {
                    "label": "28",
                    "value": 28
                }
            ]
        },
        "3!T": {
            "aggregates": [
                {
                    "label": "2",
                    "value": 2
                }
            ]
        },
        "4!T": {
            "aggregates": [
                {
                    "label": "1",
                    "value": 1
                }
            ]
        },
        "5!T": {
            "aggregates": [
                {
                    "label": "1",
                    "value": 1
                }
            ]
        },
        "6!T": {
            "aggregates": [
                {
                    "label": "1",
                    "value": 1
                }
            ]
        },
        "7!T": {
            "aggregates": [
                {
                    "label": "1",
                    "value": 1
                }
            ]
        },
        "8!T": {
            "aggregates": [
                {
                    "label": "1",
                    "value": 1
                }
            ]
        },
        "9!T": {
            "aggregates": [
                {
                    "label": "1",
                    "value": 1
                }
            ]
        }
    },
This is absolutely INSANE. How the.... is ANYONE supposed to parse this nonsense? The field labels are garbage and I don't see any kind of mappings explained in the file itself.
Given that the JSON response from the analytics is completely and totally unusable, is there some way to call the analytics API to generate me the csv? I didn't see anything in the API -- but the JSON is horrid...