


 Apex Code Development
 You need to sign in to do that
Don't have an account?
how to show different colors in gauge dashboard in sales force?
My requirement is in that gauge chart we have to show different colors up to 5. for that i have created custom vf page, but in that i have to show only 2 different colors.
How to get different colors in gauge dashboard??
Here i'm pasted my vf page and class..
VF Page:
<apex:page controller="TestPageController">
<script>
MyChart1.on('beforeconfig', function(config) {
config.axes[0].margin=-10;
});
</script>
<apex:chart height="250" width="450" animate="true" legend="true" data="{!data}" >
<apex:axis type="Gauge" position="left" margin="-10"
minimum="0" maximum="10000" steps="2000" />
<apex:gaugeSeries dataField="score" highlight="true" tips="true" donut="60"
colorSet="#FF0000,#FACC2E,#31B404,#8A084B">
</apex:gaugeSeries>
</apex:chart>
</apex:page>
Controller :
public class TestPageController {
public TestPageController(){
}
public List<gaugeData> getData() {
double NPS_score = 0;
Account score = [Select Id, Name, Amount_1__c, Amount_2__c,AnnualRevenue From Account Where id='001i000000cxxM4' LIMIT 1];
Account score1 = [Select Id, Name, Amount_1__c From Account LIMIT 1];
List<gaugeData> data = new List<gaugeData>();
data.add(new gaugeData('AMT1', score.Amount_1__c));
data.add(new gaugeData('AMT1', score.Amount_2__c));
data.add(new gaugeData('AMT1', score.AnnualRevenue));
return data;
}
public class gaugeData {
public String name { get; set; }
public decimal score { get; set; }
public gaugeData(String name, decimal npsScore) {
this.name = name;
this.score = npsScore;
}
}
}
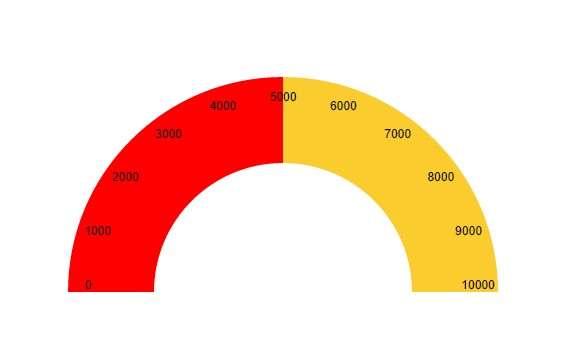
o/p is:
please find the attached screenshot.
How to get different colors in gauge dashboard??
Here i'm pasted my vf page and class..
VF Page:
<apex:page controller="TestPageController">
<script>
MyChart1.on('beforeconfig', function(config) {
config.axes[0].margin=-10;
});
</script>
<apex:chart height="250" width="450" animate="true" legend="true" data="{!data}" >
<apex:axis type="Gauge" position="left" margin="-10"
minimum="0" maximum="10000" steps="2000" />
<apex:gaugeSeries dataField="score" highlight="true" tips="true" donut="60"
colorSet="#FF0000,#FACC2E,#31B404,#8A084B">
</apex:gaugeSeries>
</apex:chart>
</apex:page>
Controller :
public class TestPageController {
public TestPageController(){
}
public List<gaugeData> getData() {
double NPS_score = 0;
Account score = [Select Id, Name, Amount_1__c, Amount_2__c,AnnualRevenue From Account Where id='001i000000cxxM4' LIMIT 1];
Account score1 = [Select Id, Name, Amount_1__c From Account LIMIT 1];
List<gaugeData> data = new List<gaugeData>();
data.add(new gaugeData('AMT1', score.Amount_1__c));
data.add(new gaugeData('AMT1', score.Amount_2__c));
data.add(new gaugeData('AMT1', score.AnnualRevenue));
return data;
}
public class gaugeData {
public String name { get; set; }
public decimal score { get; set; }
public gaugeData(String name, decimal npsScore) {
this.name = name;
this.score = npsScore;
}
}
}
o/p is:
please find the attached screenshot.
http://www.mstsolutions.com/mstblog/index.php?post/2014/02/26/Visualforce-Apex-Chart-Components