


 Apex Code Development
 You need to sign in to do that
Don't have an account?
How to build a gauge dashboard on visual force page?
Hi to all, i have created custom vf page, but in that i have to show only 2 different colors. Here i'm pasted my vf page and class..
vf page:
<apex:page controller="TestPageController">
<html>
<apex:chart height="250" width="450" animate="true" legend="true" data="{!data}" >
<apex:axis type="Gauge" position="left" margin="-10"
minimum="0" maximum="10000" steps="2000" />
<apex:gaugeSeries dataField="score" highlight="true" tips="true" donut="60"
colorSet="#FF0000,#FACC2E,#31B404,#8A084B">
</apex:gaugeSeries>
</apex:chart>
</html>
</apex:page>
Controller is:
public class TestPageController {
public TestPageController(){
}
public List<gaugeData> getData() {
double NPS_score = 0;
Account score = [Select Id, Name, Amount_1__c, Amount_2__c,AnnualRevenue From Account Where id='001i000000cxxM4' LIMIT 1];
Account score1 = [Select Id, Name, Amount_1__c From Account LIMIT 1];
List<gaugeData> data = new List<gaugeData>();
data.add(new gaugeData('AMT1', score.Amount_1__c));
data.add(new gaugeData('AMT1', score.Amount_2__c));
data.add(new gaugeData('AMT1', score.AnnualRevenue));
return data;
}
public class gaugeData {
public String name { get; set; }
public decimal score { get; set; }
public gaugeData(String name, decimal npsScore) {
this.name = name;
this.score = npsScore;
}
}
}
o/p: below screenshot
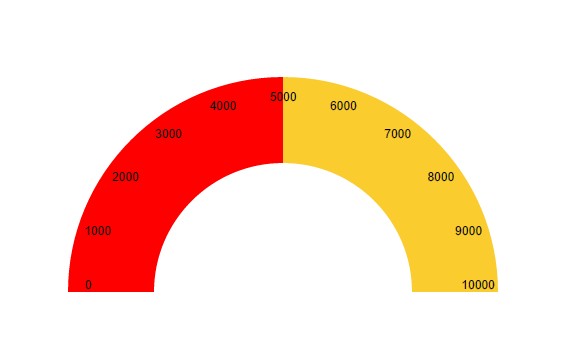
BUT MY REQUIREMNT IS WE HAVE TO SHOW DIFFERENT COLORS LIKE THIS IN THE BELOW SCREENSHOT TO SHOW IN VISUAL FORCE PAGE....
I HAVE AN IDEA ABOUT THIS TO IMPLEMENT THROUGH Scalable Vector Graphics (SVG) SCRIPT, BUT I DONT KNOW THE PROCESS..
CAN ANY ONE HELP ME WITH SAMPLE CODE?????
I WANT GAUGE DASHBOARD LIKE THIS..
vf page:
<apex:page controller="TestPageController">
<html>
<apex:chart height="250" width="450" animate="true" legend="true" data="{!data}" >
<apex:axis type="Gauge" position="left" margin="-10"
minimum="0" maximum="10000" steps="2000" />
<apex:gaugeSeries dataField="score" highlight="true" tips="true" donut="60"
colorSet="#FF0000,#FACC2E,#31B404,#8A084B">
</apex:gaugeSeries>
</apex:chart>
</html>
</apex:page>
Controller is:
public class TestPageController {
public TestPageController(){
}
public List<gaugeData> getData() {
double NPS_score = 0;
Account score = [Select Id, Name, Amount_1__c, Amount_2__c,AnnualRevenue From Account Where id='001i000000cxxM4' LIMIT 1];
Account score1 = [Select Id, Name, Amount_1__c From Account LIMIT 1];
List<gaugeData> data = new List<gaugeData>();
data.add(new gaugeData('AMT1', score.Amount_1__c));
data.add(new gaugeData('AMT1', score.Amount_2__c));
data.add(new gaugeData('AMT1', score.AnnualRevenue));
return data;
}
public class gaugeData {
public String name { get; set; }
public decimal score { get; set; }
public gaugeData(String name, decimal npsScore) {
this.name = name;
this.score = npsScore;
}
}
}
o/p: below screenshot
BUT MY REQUIREMNT IS WE HAVE TO SHOW DIFFERENT COLORS LIKE THIS IN THE BELOW SCREENSHOT TO SHOW IN VISUAL FORCE PAGE....
I HAVE AN IDEA ABOUT THIS TO IMPLEMENT THROUGH Scalable Vector Graphics (SVG) SCRIPT, BUT I DONT KNOW THE PROCESS..
CAN ANY ONE HELP ME WITH SAMPLE CODE?????
I WANT GAUGE DASHBOARD LIKE THIS..