


 Apex Code Development
 You need to sign in to do that
Don't have an account?
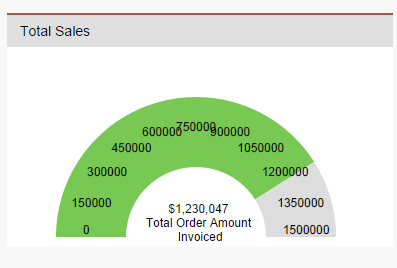
Add settings on meter gauge to get maximum limit value dynamically like settings
I am creating a dashboard using Visual force page. I have inserted a meter gauge chart on the page. Now I have to set the maximum value dynamically of the chart this should be like 100k,200k,300k....1m or 100m,200m...1B
How can i add this maximum value dynamically like a setting. And add a maximum value.
<apex:outputPanel id="TotalSales">
<apex:outputLabel value="Total Sales" styleClass="Headerclass" />
<script>
MyChart.on('TotalSales', function(config) {
config.axes[0].margin=-10;
});
</script>
<div class="metergaugeCSS" >
<apex:chart name="TotalSales" height="200px" width="100%"
animate="true" data="{!TotalSales}" >
<apex:legend position="top" font="bold 8px Helvetica" padding="15"/>
<apex:axis type="Gauge" position="gauge"
minimum="0"
maximum="{!TotalSales[0].maxValue}" steps="3" margin="-15">
<div style="text-align: center; margin-top: -45px;">
<apex:outputText value="{0, number,$###,###}">
<apex:param value="{!TotalSales[0].size}"/>
</apex:outputText>
<br/> Total Order Amount <br/> Invoiced
</div>
</apex:axis>
<apex:gaugeSeries dataField="size" donut="50"
colorSet="#78c953,#ddd" />
</apex:chart>
</div>
</apex:outputPanel>
================================================= Controller
//Get values for Total Sales chart representation.
public List<gaugeData > getTotalSales() {
List<AggregateResult> totalSales = [select SUM(Order_Amount__c) totalAmount , Show__r.Name showName from Non_Booth_Item__c where Show__c =:currentShow.Id and Item_Status__c !='cancelled' Group By Show__r.Name ];
List<gaugeData> data = new List<gaugeData>();
Integer maxvalue= Integer.valueOf(currentShow.Estimated_Revenue__c);
if(!totalSales.isEmpty()){
Decimal i = ((Decimal) totalSales[0] .get('totalAmount') ).setScale(2);
data.add(new gaugeData(String.valueOf(totalSales[0].get('showName')), i,maxvalue));
}
else
{
data.add(new gaugeData('', 0,maxvalue));
}
return data ;
}
=========
//Wrapper class for showing values on gauge for max and minimum value.
public class gaugeData {
public String name { get; set; }
public Decimal size { get; set; }
public Integer maxValue {get;set;}
public gaugeData(String name, Decimal data, Integer maxValue) {
this.name = name;
this.size = data;
this.maxValue = maxValue;
}
}