


You need to sign in to do that
Don't have an account?
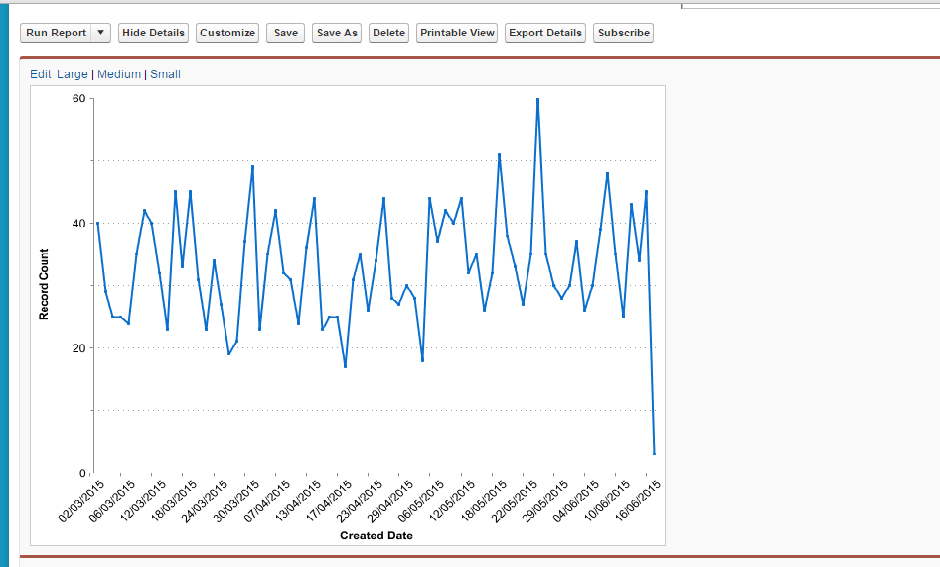
Trend Line Report
I would like to create a report for trend line in below report for salesforce. Then How to do create the Trend Line report for report tab in salesforce
 Starting November 20, the site will be set to read-only.
On December 4, 2023,
Starting November 20, the site will be set to read-only.
On December 4, 2023, Apex Code Development (90768)
General Development (55146)
Visualforce Development (37251)
Lightning (18265)
APIs and Integration (17146)
Trailhead (11680)
Formulas & Validation Rules Discussion (11337)
Other Salesforce Applications (8116)
Jobs Board (6655)
Force.com Sites & Site.com (4842)
Mobile (2694)
Apex Code Development (90768)
General Development (55146)
Visualforce Development (37251)
Lightning (18265)
APIs and Integration (17146)
Trailhead (11680)
Formulas & Validation Rules Discussion (11337)
Other Salesforce Applications (8116)
Jobs Board (6655)
Force.com Sites & Site.com (4842)
Mobile (2694)
You need to sign in to do that
Don't have an account?
Drag the line chart icon to the third column of the dashboard.
Click the Data Sources tab and start typing Revenue Trend by Type into the search box.
When you find your report, drag it onto the line chart component. Add a header, title, and footer by clicking those fields on the component:
Enter Trends for the header.
Enter Revenue Trend by Type for the title.
Enter Goal: Drive New and Add-on Business for the footer.
Click [Edit component icon] to edit the component. On the Component Data tab, select the parameters you need.
Choose Sum of Amount for the Y-Axis. Notice how the summary field and summary formula you created in the report are available in the drop-down besides record count.
Choose Close Month for the X-Axis. The choices here are column and row groupings from the report.
Choose Type for Group By.
Please see the link below
https://developer.salesforce.com/docs/atlas.en-us.workbook_analytics.meta/workbook_analytics/analytics3_step4.htm
Best Regards
Naga Kiran
I would like to create a report not dashboard.