


 Apex Code Development
 You need to sign in to do that
Don't have an account?
Highchart primary and secondary axis issue
<apex:page Controller="Metrics_rptAIReportController2">
<head>
</head>
<body>
<apex:outputLink target="_Blank" value="/apex/Metrics_AI_ADRC_Dashboard" id="theLink" ><apex:image id="ITPR_EnlargeIcon" value=" {!$Resource.ITPR_EnlargeIcon}" /></apex:outputLink>
<div id="container" style="min-width: 310px; height: 400px; margin: 0 auto"></div>
<script src="https://ajax.googleapis.com/ajax/libs/jquery/2.1.1/jquery.min.js"></script>
<script src="{!URLFOR($Resource.Highcharts)}"></script>
<script>
$(function () {
$('#container').highcharts({
chart: {
zoomType: 'xy'
},
title: {
text: 'ADRC Dollar Amount Expended'
},
xAxis: [{
categories: [<apex:repeat value="{!ACRecord}" var="im">
'{!MONTH(im.Reporting_Month__c)}/{!YEAR(im.Reporting_Month__c)}',
</apex:repeat>],
labels: {
rotation: -45,
align: 'right',
}
}]
yAxis: [{ // Primary yAxis
labels: {
format: '{value}%',
style: {
color: '#89A54E'
}
},
title: {
text: '% of Allocated Dollars Expended',
style: {
color: '#4572A7'
}
}
},
{ // Secondary yAxis
title: {
text: 'Total Dollars Allocated',
style: {
color: '#4572A7'
}
},
labels: {
format: '{value}',
style: {
color: '#4572A7'
}
},
opposite: true
}],
tooltip: {
shared: true
},
series:
{
name: '% of Allocated Dollars Expended',
color: '#0066FF',
type: 'line',
data: [<apex:repeat value="{!ACRecord}" var="pade">
{!pade.Total_To_Date__c },
</apex:repeat>],
tooltip: {
valueSuffix: '%',
valueDecimals: 2
}},
{
name: 'Total Allocated Dollar',
color: '#ff0000',
type: 'line',
yAxis: 1,
data: [<apex:repeat value="{!ACRecord}" var="tad">
{!tad.MetricA_IParent_Id__r.ADRC_Total_Dol_ExpenditurePercent__c},
</apex:repeat>],
tooltip: {
valueSuffix: '%'
}},
{
name: 'Total Allocated Dollar Expended',
color: '#00cc00',
type: 'column',
yAxis: 1,
data: [<apex:repeat value="{!ACRecord}" var="tade">
{!tade.ADRC_Total_Dol_Expended__c},
</apex:repeat>],
tooltip: {
valueSuffix: ''
}}
]
});
});
</script>
</body>
</apex:page>
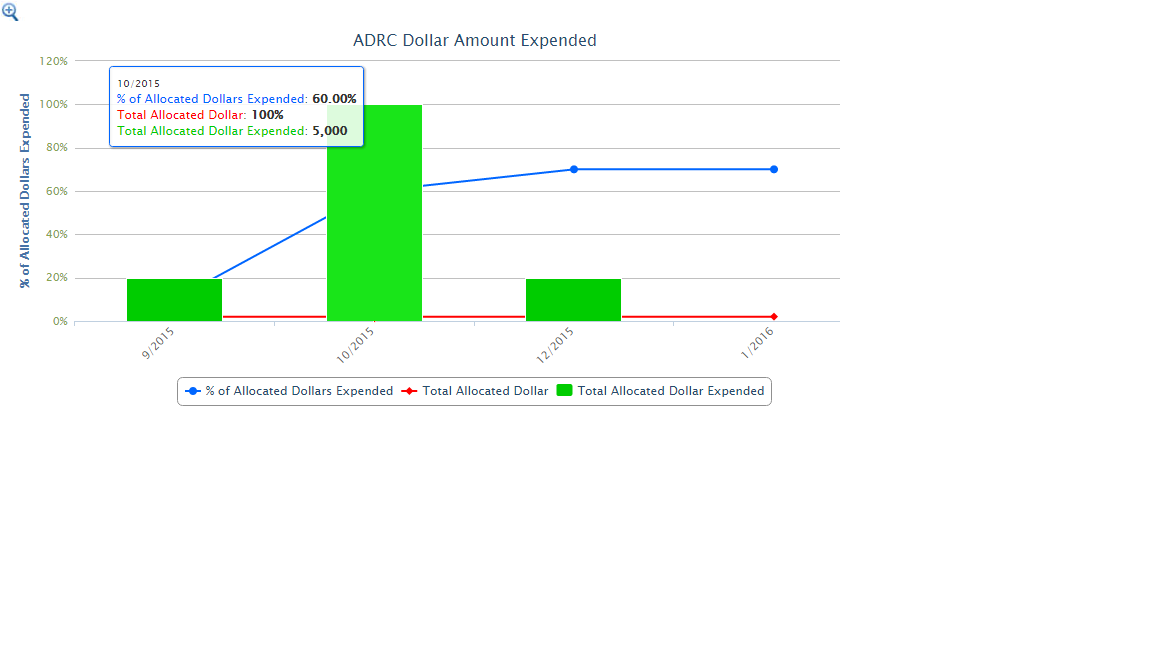
In the vf page tad.MetricA_IParent_Id__r.ADRC_Total_Dol_ExpenditurePercent__c is a percentage field (shown in red below). The highchart has a primary and secondary y axis. The pade.Total_To_Date__c field is also a percent field (blue line). The vf page shows this field correctly.
Although the tooltip shows the value of the Total Allocated Dollar as 100% it maps to the seconday y axis. How can I make it map to the 100% line on the primary axis which is on the left hand side of the chart?
<head>
</head>
<body>
<apex:outputLink target="_Blank" value="/apex/Metrics_AI_ADRC_Dashboard" id="theLink" ><apex:image id="ITPR_EnlargeIcon" value=" {!$Resource.ITPR_EnlargeIcon}" /></apex:outputLink>
<div id="container" style="min-width: 310px; height: 400px; margin: 0 auto"></div>
<script src="https://ajax.googleapis.com/ajax/libs/jquery/2.1.1/jquery.min.js"></script>
<script src="{!URLFOR($Resource.Highcharts)}"></script>
<script>
$(function () {
$('#container').highcharts({
chart: {
zoomType: 'xy'
},
title: {
text: 'ADRC Dollar Amount Expended'
},
xAxis: [{
categories: [<apex:repeat value="{!ACRecord}" var="im">
'{!MONTH(im.Reporting_Month__c)}/{!YEAR(im.Reporting_Month__c)}',
</apex:repeat>],
labels: {
rotation: -45,
align: 'right',
}
}]
yAxis: [{ // Primary yAxis
labels: {
format: '{value}%',
style: {
color: '#89A54E'
}
},
title: {
text: '% of Allocated Dollars Expended',
style: {
color: '#4572A7'
}
}
},
{ // Secondary yAxis
title: {
text: 'Total Dollars Allocated',
style: {
color: '#4572A7'
}
},
labels: {
format: '{value}',
style: {
color: '#4572A7'
}
},
opposite: true
}],
tooltip: {
shared: true
},
series:
{
name: '% of Allocated Dollars Expended',
color: '#0066FF',
type: 'line',
data: [<apex:repeat value="{!ACRecord}" var="pade">
{!pade.Total_To_Date__c },
</apex:repeat>],
tooltip: {
valueSuffix: '%',
valueDecimals: 2
}},
{
name: 'Total Allocated Dollar',
color: '#ff0000',
type: 'line',
yAxis: 1,
data: [<apex:repeat value="{!ACRecord}" var="tad">
{!tad.MetricA_IParent_Id__r.ADRC_Total_Dol_ExpenditurePercent__c},
</apex:repeat>],
tooltip: {
valueSuffix: '%'
}},
{
name: 'Total Allocated Dollar Expended',
color: '#00cc00',
type: 'column',
yAxis: 1,
data: [<apex:repeat value="{!ACRecord}" var="tade">
{!tade.ADRC_Total_Dol_Expended__c},
</apex:repeat>],
tooltip: {
valueSuffix: ''
}}
]
});
});
</script>
</body>
</apex:page>
In the vf page tad.MetricA_IParent_Id__r.ADRC_Total_Dol_ExpenditurePercent__c is a percentage field (shown in red below). The highchart has a primary and secondary y axis. The pade.Total_To_Date__c field is also a percent field (blue line). The vf page shows this field correctly.
Although the tooltip shows the value of the Total Allocated Dollar as 100% it maps to the seconday y axis. How can I make it map to the 100% line on the primary axis which is on the left hand side of the chart?
From what it looks like, you are *not* getting back any data for any records for that particular field. Are you even querying that relationship / field? Do you have the proper field level security to display it? Once you get that field correctly populated, then you should see the correct graph.
1. I am querying for this field in the controller. This is a formula field and returns 100%. The tooltip also shows Total Allocated Dollar as 100%.
This should have been the original image - i failed to show the secondary y axis in my previous post.
2. I tried something else - enlarged the map and turned off the two other variables and here is what the image looks like. It aligns on the right with the 100 which is the seconday axis but it should actually show the %values on the left and align with 100%
Please advise if I am missing something. Thank you.