


 Apex Code Development
 You need to sign in to do that
Don't have an account?
Timeline Graph in Wave with computed fields (ratio)
Hello -- I am new to wave and was hoping someone could help me figure out how to graph a computed field onto a timeline. I've done some resarch and I believe I need to modify the SAQL to accomplish this, I get lost trying to get the data from the SAQL response into the apropriate grouping and then displayed in a graph.
Background:
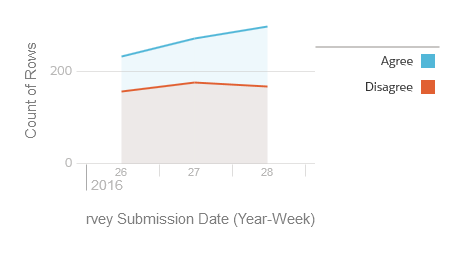
My team is doing a survey. Survey respondents are given a statement and they either agree or disagree with it. The response is saved as a row in a object with the result of agree/disagree and the date they responded. The survey runs continously and hundreds of people respond every week. Response rates are not consistent week to week.
The goal is to create a graph that shows the percentage of survey respondents that agree with the statement grouped by week. We can then analyze if there is a trend in agreement over time.
I've managed to create a timeline graph that groups responses by week that shows the total count of rows of agreement and disagreement as two seperate lines:
I'd like to get this to one line that has a percentage (Agree/(Agree+Disagree)) by week. Because the response rates vary (and may even vary at a greater rate in the future), its difficult to tell the trend at a glance.
The lens I have above I've managed to convert to pigql like what you see on lines 24-31 in the example code on this page:
https://developer.salesforce.com/docs/atlas.en-us.202.0.bi_dev_guide_json.meta/bi_dev_guide_json/bi_dbjson_query_example.htm?search_text=saql
Then the problems start! When I put groupings into the pigql, operations, or functions they do not make it back into the graph. I can put groupings and mesure information into the json and if that data is available in the pigql it will graph correctly. Since you can't have ratios in the json coding (nor the fancy functions available in SAQL) I am a bit stuck here. I can't get the 'measure' to change from a count to ratio either (y axis).
Any insight greatly appreciated!
Background:
My team is doing a survey. Survey respondents are given a statement and they either agree or disagree with it. The response is saved as a row in a object with the result of agree/disagree and the date they responded. The survey runs continously and hundreds of people respond every week. Response rates are not consistent week to week.
The goal is to create a graph that shows the percentage of survey respondents that agree with the statement grouped by week. We can then analyze if there is a trend in agreement over time.
I've managed to create a timeline graph that groups responses by week that shows the total count of rows of agreement and disagreement as two seperate lines:
I'd like to get this to one line that has a percentage (Agree/(Agree+Disagree)) by week. Because the response rates vary (and may even vary at a greater rate in the future), its difficult to tell the trend at a glance.
The lens I have above I've managed to convert to pigql like what you see on lines 24-31 in the example code on this page:
https://developer.salesforce.com/docs/atlas.en-us.202.0.bi_dev_guide_json.meta/bi_dev_guide_json/bi_dbjson_query_example.htm?search_text=saql
Then the problems start! When I put groupings into the pigql, operations, or functions they do not make it back into the graph. I can put groupings and mesure information into the json and if that data is available in the pigql it will graph correctly. Since you can't have ratios in the json coding (nor the fancy functions available in SAQL) I am a bit stuck here. I can't get the 'measure' to change from a count to ratio either (y axis).
Any insight greatly appreciated!
Can you help?
I am doing union saql query to bring the data together. have you used the union query in this way previously?
here is the r = load "x";
r_A = filter r by 'Stage_High_Level' == "Closed Won";
r_A = group r_A by ('Stage_High_Level', 'Oppt_Close_Date_Year', 'Oppt_Close_Date_Month');
r_A = foreach r_A generate r_A.'Stage_High_Level' as 'Stage_High_Level', r_A.'Oppt_Close_Date_Year' + "~~~" + r_A.'Oppt_Close_Date_Month' as 'Oppt_Close_Date_Year~~~Oppt_Close_Date_Month', sum(r_A.'Opportunity_Amount_converted') as 'A';
r_A = order r_A by ('Stage_High_Level' asc, 'Oppt_Close_Date_Year~~~Oppt_Close_Date_Month' asc);
r_A = limit r_A 2000;
q = load "y";
q_A = filter q by date('ClosedDate_Year', 'ClosedDate_Month', 'ClosedDate_Day') in ["1 year ago".."current year"];
q_A = group q_A by ('Stage_High_Level', 'ClosedDate_Year', 'ClosedDate_Month');
q_A = foreach q_A generate q_A.'Stage_High_Level' as 'Stage_High_Level', q_A.'ClosedDate_Year' + "~~~" + q_A.'ClosedDate_Month' as 'ClosedDate_Year~~~ClosedDate_Month', sum(q_A.'Target') as 'A';
q_A = order q_A by ('Stage_High_Level' asc, 'ClosedDate_Year~~~ClosedDate_Month' asc);
q_A = limit q_A 2000;
s = union q_A, r_A;